Turn on suggestions
Auto-suggest helps you quickly narrow down your search results by suggesting possible matches as you type.
- Dynatrace Community
- Dynatrace
- Ask
- Alerting
- Use Tags in custom Alerts
Options
- Subscribe to RSS Feed
- Mark Topic as New
- Mark Topic as Read
- Pin this Topic for Current User
- Printer Friendly Page
Options
- Mark as New
- Subscribe to RSS Feed
- Permalink
20 Mar 2018
12:03 PM
- last edited on
11 Aug 2022
12:41 PM
by
![]() MaciejNeumann
MaciejNeumann
Hi,
I tried to setup an alert on the slowdown of a web request to an external system which is not monitored by dynatrace.
I first had a look on the Request and found the Tag Request type there (that is a valid tag isn't it?)
After that I opened the settings and navigated to the alerting profiles. I set up a new profile with a custom rule. But when I try to filter on the request type tag it won't allow that. Can somebody help me out?
regards,
Gerald
Solved! Go to Solution.
8 REPLIES 8
Options
- Mark as New
- Subscribe to RSS Feed
- Permalink
20 Mar 2018 02:40 PM
Hi @Gerald M.,
In the settings, did you add the new custom tag under Manually Applied Tags or Automatically Applied Tags? If I remember right, I had the same issue if I added it to automatically applied tags instead of manually applied tags, but I'll double check that.
Options
- Mark as New
- Subscribe to RSS Feed
- Permalink
20 Mar 2018 08:01 PM
Hello @Gerald M.
We were able to create custom alerts and below is what we did
1. Settings -> Log analytics -> Log-based events->Created a detection rule for custom log events
2. Settings -> Tags -> Automatically applied tags -> Add new custom tag (we created ours based on the process group and executable)
3. Settings -> Alerting profiles -> Create new alerting rule -> ' Filter problems by tag(Only include entities that have any tags)
(Custom alert (Immediate; Tag that was created and linked to the Process Group)
Hope the above steps will help you to get what you need.
Options
- Mark as New
- Subscribe to RSS Feed
- Permalink
21 Mar 2018 07:00 AM
Hi @Rocky O. and @Venkata C.
I guess your comments already answered my first question.
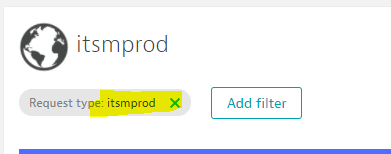
So the thing you can see on my first picture is no Tag i can user for alerting ? I mean the Request Type: itsmprod.
Because this one was generated without any configuration.
The second question would be how I can tag a request to an external domain with the external domain name?
I tried with an automatically tag and a condition on public domain name and also remote endpoint. But I guess those apply to the public domain name of the monitored service and not the external one, right?
regards,
Gerald
Options
- Mark as New
- Subscribe to RSS Feed
- Permalink
22 Mar 2018 03:59 PM
Hello @Gerald M.
I have couple questions
1. Are you able to see data under Settings -> Log analytics -> Log-based events 'Detection rules for custom log events' ? ( for us we see a bar when the event occurs and we have select Generate the issue under Log Error Problem)
2. Settings -> Tags -> Automatically applied tags -> Rules, when you click preview do you see any results? ( for us we see the executable shown, that indicates the rule is valid )
Options
- Mark as New
- Subscribe to RSS Feed
- Permalink
23 Mar 2018 07:24 AM
Thank you for your reply.
1. No that screen seems to be empty. I only have a button saying "Add new detection rule for custom log events". But I guess the thing I want to track is not a log event
2. The Preview Button is very helpful. I tried several settings, but I found no condition mapping my scenario.
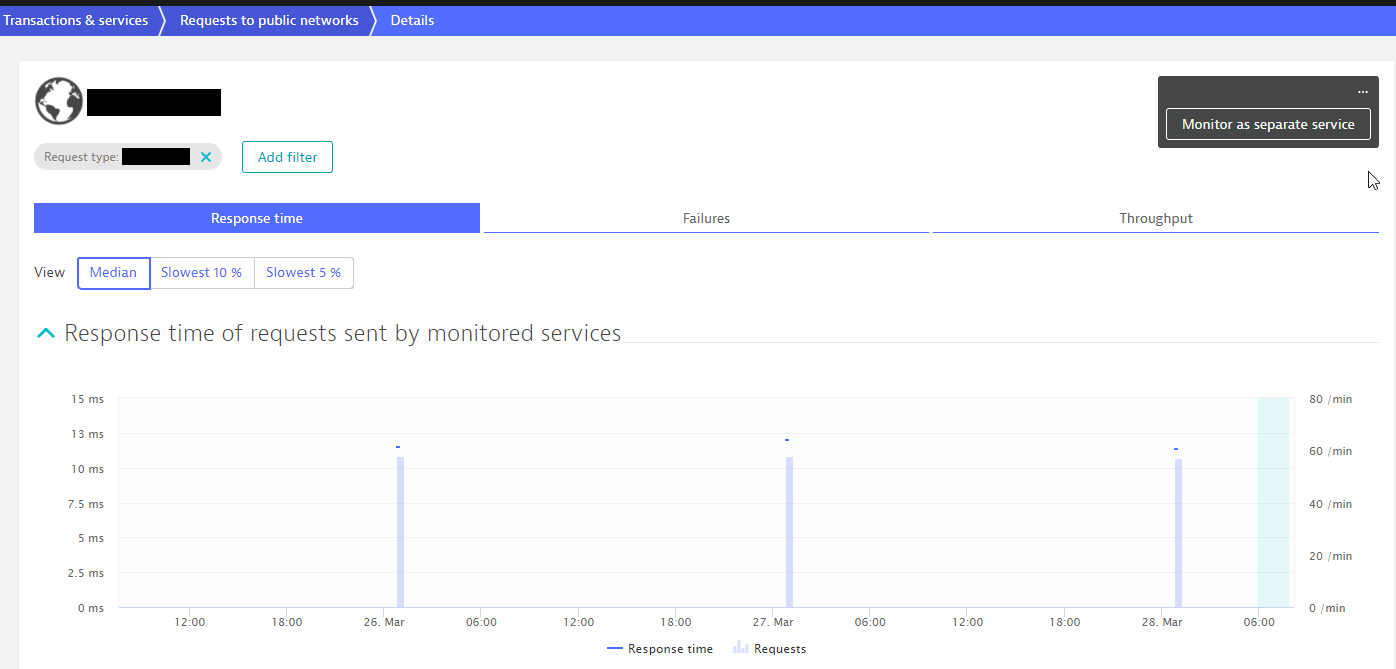
What I want to reach is an alert if the request type itsmprod within the service "Requests to public network" has a problem. I'm able to tag the service itself, but I find no way to alert only on the one type of requests. But I can see Problems because of the slowdown of the request type itsmprod.
regards,
Gerald
Options
- Mark as New
- Subscribe to RSS Feed
- Permalink
23 Mar 2018 01:40 PM
Isnt this "itsmprod" a request attribute? Request attributes cannot be used as tags for the alerting profile. To check go to Settings>Server-side>Request Attributes. You will need to do a Manual Tag or Automatic Tag rule to use with the custom alerting profile.
Options
- Mark as New
- Subscribe to RSS Feed
- Permalink
27 Mar 2018 02:42 PM
Hi @Fabio F.,
No it's no request attribute, at least it is not listed within the section you wrote above.
I didn't configure that RequestType on my own, it is displayed from installation on for every Request to external hosts.
How can I setup a manual or automatic tag on that request attribute, so that I'm able to user it within the alerting profile?
regards,
Gerald
Options
- Mark as New
- Subscribe to RSS Feed
- Permalink
28 Mar 2018 07:07 AM
Hi,
I found the solution now.
I had to mark the third party service as a separate service.
Afterwards I could apply a manual tag on it.
regards,
Gerald
Reply
