Turn on suggestions
Auto-suggest helps you quickly narrow down your search results by suggesting possible matches as you type.
- Dynatrace Community
- Dynatrace
- Ask
- Open Q&A
- Batch profiling with custom services
Options
- Subscribe to RSS Feed
- Mark Topic as New
- Mark Topic as Read
- Pin this Topic for Current User
- Printer Friendly Page
Options
- Mark as New
- Subscribe to RSS Feed
- Permalink
05 Nov 2018
01:05 PM
- last edited on
27 Feb 2023
08:40 AM
by
![]() Karolina_Linda
Karolina_Linda
Hello,
I'm trying to find where the time is consumed in a Java batch application with Dynatrace. I created a custom entry point (custom service) that match the main method of the batch and the method called iteratively. The process is detected but I don't know where to find the resulted distributed traces.
JP
Solved! Go to Solution.
Labels:
- Labels:
-
distributed traces
-
services
4 REPLIES 4
Options
- Mark as New
- Subscribe to RSS Feed
- Permalink
05 Nov 2018 02:19 PM
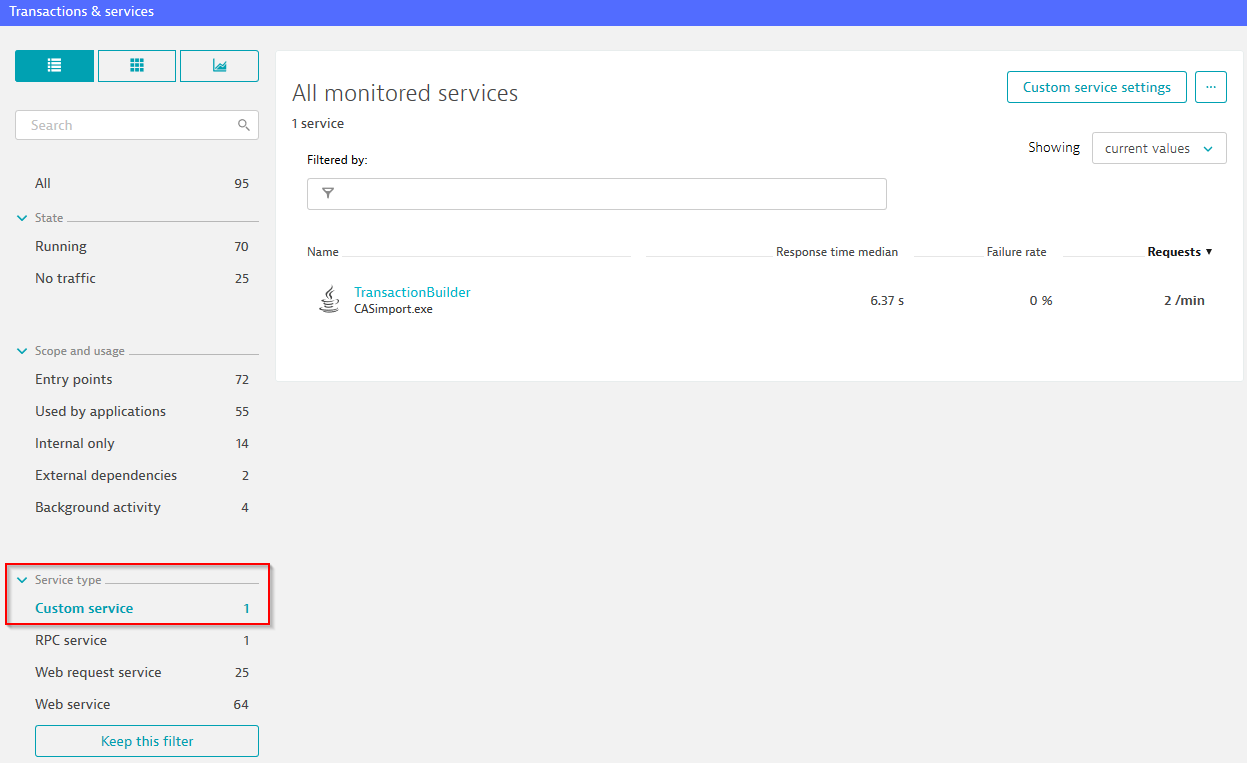
You should see the custom service in the Transactions & services overview.
You can use the filter for Service Type: Custom service:
Dynatrace Certified Master, AppMon Certified Master - Dynatrace Partner - 360Performance.net
Options
- Mark as New
- Subscribe to RSS Feed
- Permalink
05 Nov 2018 03:07 PM
Thank you @Patrick H. for your answer. I was trying on a test batch :
public class Entree {
	public static void main(String[] args) throws Exception {
		doIt();
	}
	private static void doIt() throws InterruptedException {
		while (true) {
			System.out.println(" Il est " + new Date() );
			Thread.sleep(5000);
		}
	}
}
and it didn't work (?).
I tried on my real batch, and now it seems to works.
Thank you for your help,
JP
Reply
Options
- Mark as New
- Subscribe to RSS Feed
- Permalink
06 Nov 2018 09:43 AM
Maybe you didn't restart the process or activate Hot Sensor Placement for Java when configuring the test Batch?
Dynatrace Certified Master, AppMon Certified Master - Dynatrace Partner - 360Performance.net
Options
- Mark as New
- Subscribe to RSS Feed
- Permalink
06 Nov 2018 12:32 PM
Patrick,
I did restart the process. I'll try to understand later, when I have some time.
Regards,
JP
