Turn on suggestions
Auto-suggest helps you quickly narrow down your search results by suggesting possible matches as you type.
- Dynatrace Community
- Dynatrace
- Ask
- Open Q&A
- Database - getConnections() Response Time chart and JDBC pool status
Options
- Subscribe to RSS Feed
- Mark Topic as New
- Mark Topic as Read
- Pin this Topic for Current User
- Printer Friendly Page
Database - getConnections() Response Time chart and JDBC pool status
Options
- Mark as New
- Subscribe to RSS Feed
- Permalink
05 Nov 2018 04:36 PM
Hi,
We have some issues with Database JDBC Connections Pools. The thing is that there are less and less connections ready reaching 0 connections available (we got this data from Weblogic Console). The getConnections() Response Time is growing because of Free Connections availability.
Questions:
- Is there any way to chart getConnections() time to evidence the DB issue?
- Is there any way to check JDDB Connections status and how long does the application spend getting (avg,min,max) these connections?
Thanks in advance.
Alberto.
Labels:
- Labels:
-
databases
4 REPLIES 4
Options
- Mark as New
- Subscribe to RSS Feed
- Permalink
06 Nov 2018 09:50 AM
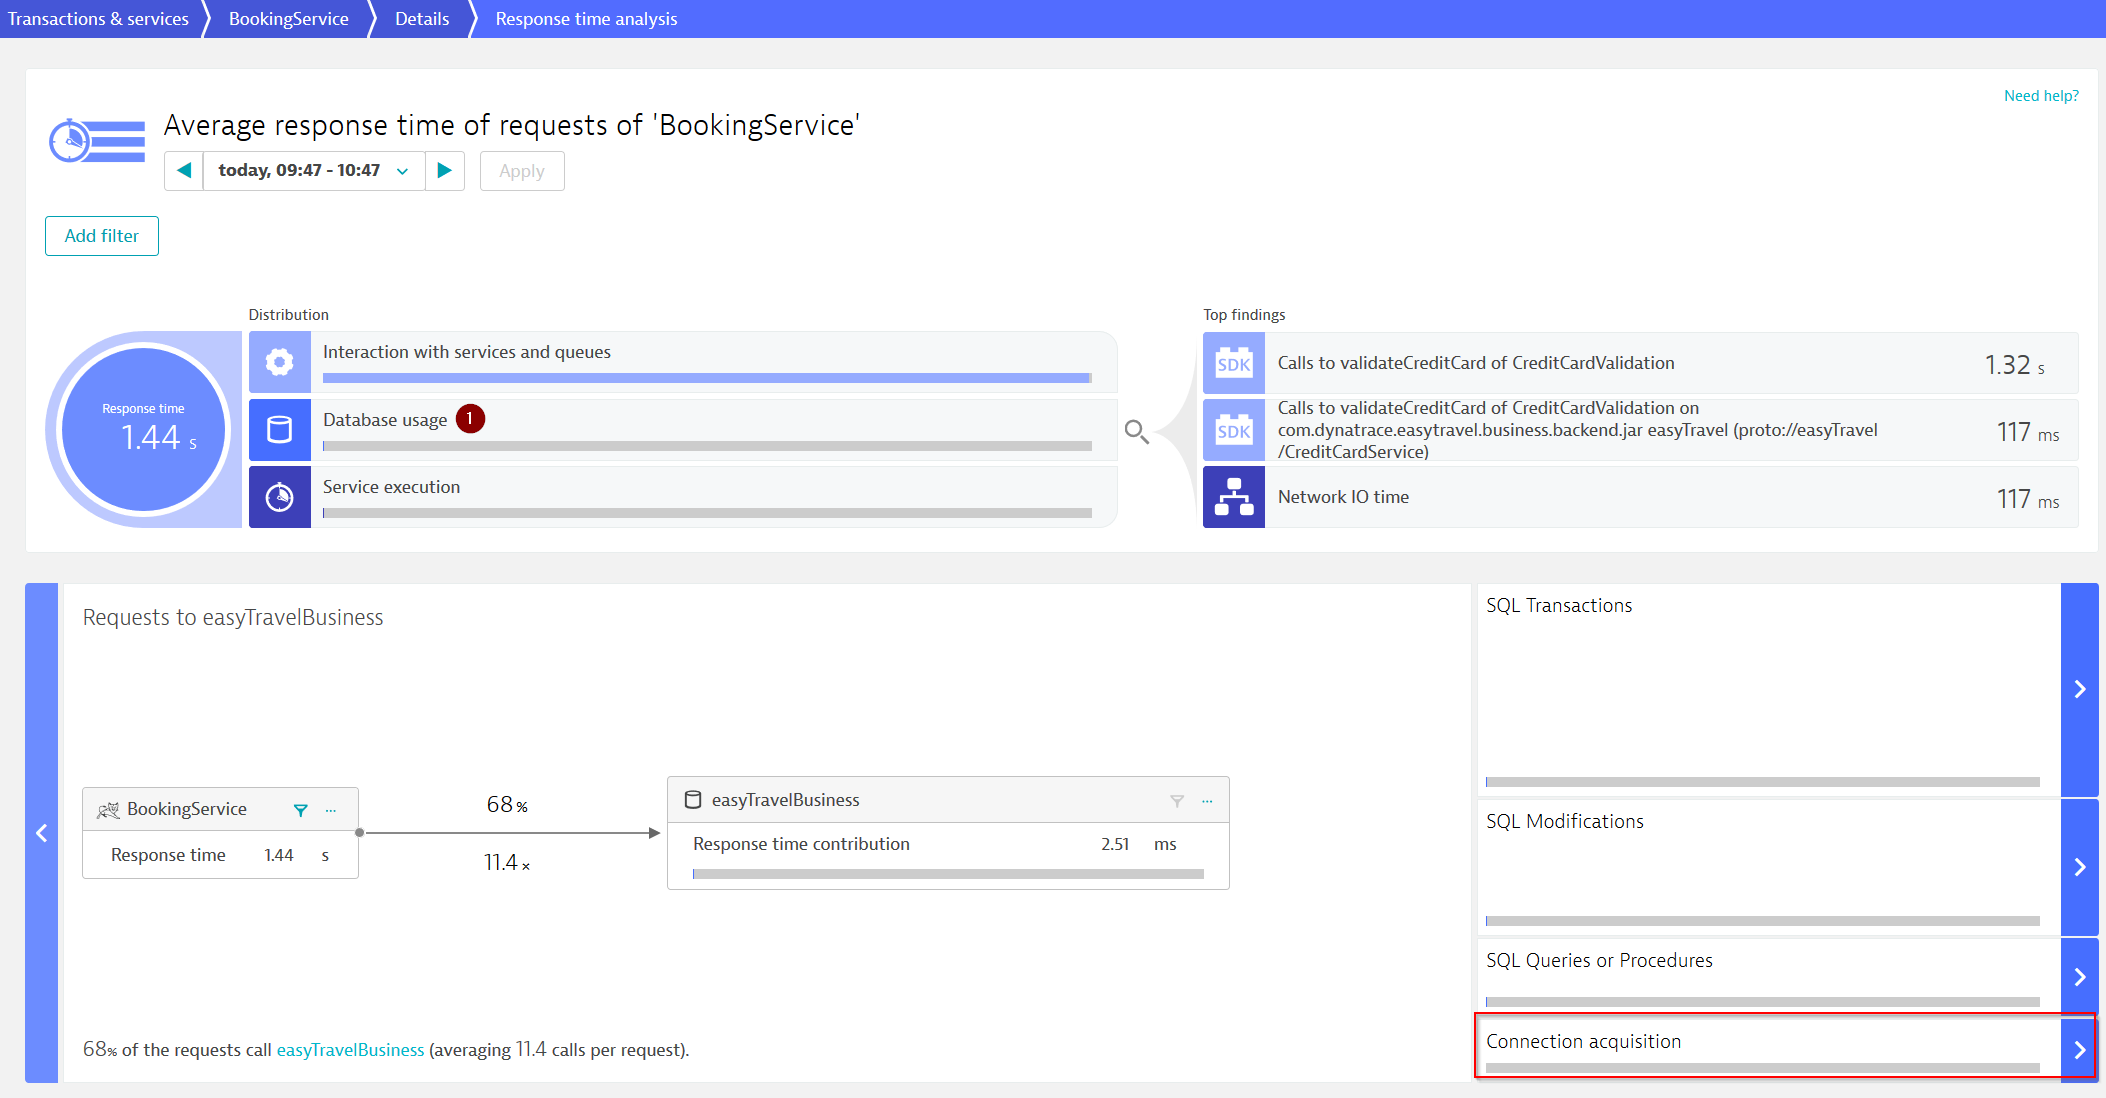
Dynatrace does detect the time spent on connection acquisition for DB calls by default.
Open a service that is calling the DB and go to the Response time breakdown. If you select Database usage there you will get the time spent on connection acquisition and actual statements:
Dynatrace Certified Master, AppMon Certified Master - Dynatrace Partner - 360Performance.net
Options
- Mark as New
- Subscribe to RSS Feed
- Permalink
06 Nov 2018 10:14 AM
Hello Alberto,
I think dynatrace already collects these kind of data in the database view. There you can see Failed connects. Unfortunately you cannot pin this view in a dashboard.
I thought about two methods to get the getConnection() response time.
Method 1 :
You define a custom service on that method. But the big trouble is finding the class that encapsulate the getConnection() method. After a little research I find this one (it is specific to the environment we are monitoring) :
http://docs.jboss.org/hibernate/orm/3.5/javadoc/or...
It could be another class.
Method 2 :
I prefer this one. But, I did not dig much further. You have to set up JMX metrics capture on Dynatrace through a plugin. In that case, you will have access to some metrics listed on this link
https://docs.oracle.com/cd/E72987_01/wls/WLACH/pag...
Best regards,
Fousseyni B.
Options
- Mark as New
- Subscribe to RSS Feed
- Permalink
06 Nov 2018 12:34 PM
Hi,
I thought about creating a Sensor but I found here two important issues, first one is difficulty of finding for each Application Server / version the proper method and the second and most important issue, is the potencial huge overhead that this sensor could cause (millions of calls to that method).
Via JMX I'd get some info about current connections, max , etc but I cannot chart getConnection() time, I don't need de Acquisition time Service by Service but the Acquisition time for the whole services (avg). Then it'd be possible to merge the chart with getConnection()Response time with JDBC Pool info taken via JMX.
Alberto.
Options
- Mark as New
- Subscribe to RSS Feed
- Permalink
21 Jan 2019 10:41 AM
@Bouare F. @Alberto D. Could you please share a sample plugin.json to get Connection details from an Oracle DB?
