• Forums
    • Public Forums
      • Community Connect
      • Dynatrace
        • Dynatrace Open Q&A
      • Application Monitoring & UEM
        • AppMon & UEM Open Q&A
      • Network Application Monitoring
        • NAM Open Q&A
  • Home
  • Public Forums
  • Dynatrace
  • Dynatrace Open Q&A
avatar image
Question by Marce C. · Jun 25, 2019 at 10:44 AM · dashboard monitoring http monitors

How to track Google Tag Manager and site speed/load time?

Hi there!


I'm new to Dynatrace. I'm on the advertising area of the company and need to keep track of load time (from a site visitor perspective). We are using Google Tag Manager.


Is there any way I can know how changes on Google Tag Manager affect site speed/efficiency? I want to be able to tell the ads team how GTM affects load speed over time, with a timeline charts, if possible.


Thanks!

Comment

People who like this

0 Show 0
10 |2000000 characters needed characters left characters exceeded
  • Viewable by all users
  • Viewable by moderators
  • Viewable by moderators and the original poster
  • Advanced visibility
Toggle Comment visibility. Current Visibility: Viewable by all users

Up to 10 attachments (including images) can be used with a maximum of 50.0 MiB each and 250.0 MiB total.

2 Replies

  • Sort: 
  • Most voted
  • Newest
  • Oldest
avatar image

Answer by Mikhail A. · Jun 25, 2019 at 01:22 PM

Hello

Dynatrace have Real User Monitoring which gives you the power to know your customers by providing performance analysis in real time. This includes all user actions taken and how the various actions impact performance. https://www.dynatrace.com/support/help/how-to-use-dynatrace/real-user-monitoring/

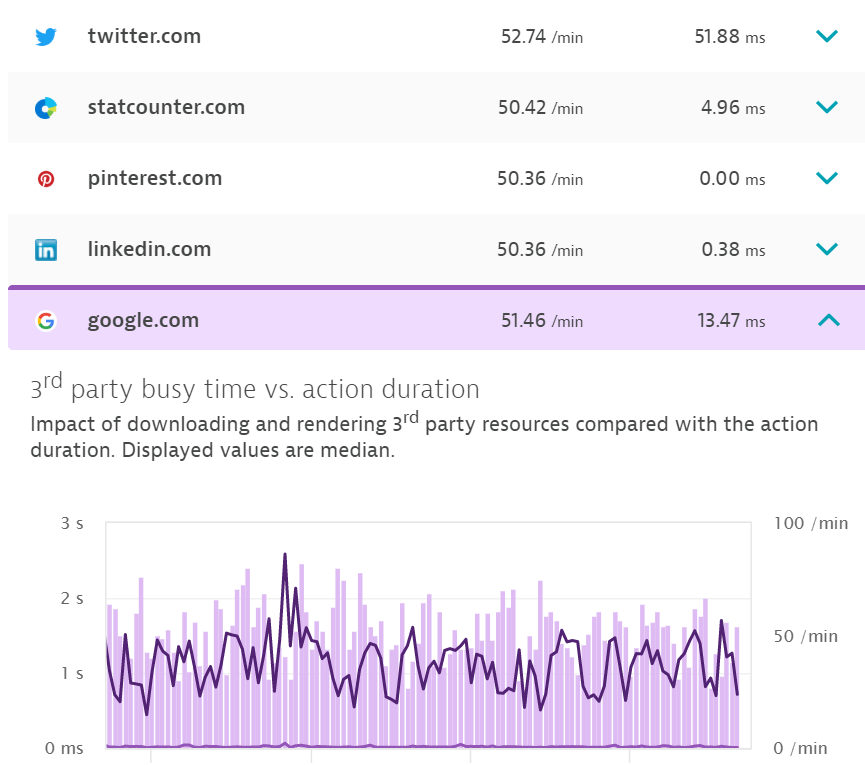
Real User Monitoring provides waterfall monitoring for each page. You can see impact or different resource (including 3rd party and CDN) to load page time (https://www.dynatrace.com/support/help/how-to-use-dynatrace/real-user-monitoring/how-to-use-real-user-monitoring/cross-application-user-session-analytics/analyze-individual-user-actions/ )

Also you can see it information on chart for full application performance, selected page or 3rd party and CDN


1561468708180.png (274.7 KiB)
1561468934407.png (95.2 KiB)
Comment
Marce C.

People who like this

1 Show 0 · Share
10 |2000000 characters needed characters left characters exceeded
  • Viewable by all users
  • Viewable by moderators
  • Viewable by moderators and the original poster
  • Advanced visibility
Toggle Comment visibility. Current Visibility: Viewable by all users

Up to 10 attachments (including images) can be used with a maximum of 50.0 MiB each and 250.0 MiB total.

avatar image

Answer by Marce C. · Jun 26, 2019 at 10:39 AM

Thanks! I'll take a look at the docs. Fortunately, there's many info, but it's not easy to find out how to monitor a specific set of tags...


Cheers!

Comment

People who like this

0 Show 2 · Share
10 |2000000 characters needed characters left characters exceeded
  • Viewable by all users
  • Viewable by moderators
  • Viewable by moderators and the original poster
  • Advanced visibility
Toggle Comment visibility. Current Visibility: Viewable by all users

Up to 10 attachments (including images) can be used with a maximum of 50.0 MiB each and 250.0 MiB total.

avatar image Mikhail A. · Jun 26, 2019 at 01:40 PM 0
Share

@Marce C.

I think that dynatrace should automatically recognize Google Tag Manager as 3rd party resources on you pages and you can see how it impact on load page time (but I can be wrong as I had no experience with monitoring Google Tag Manager).

if necessary, you can use JavaScript API for Add and extend 3rd-party monitoring

All resources from the resource timings are captured if the resource timing module is active. Images and JavaScript files are captured with 3rd-party module. You can use the JavaScript API to capture additional resources.

https://www.dynatrace.com/support/help/how-to-use-dynatrace/real-user-monitoring/setup-and-configuration/web-applications/additional-configuration/customize-rum/

avatar image Marce C. · Jun 26, 2019 at 01:43 PM 0
Share

Thanks again! I'll try to see what I can get and report back. About Dyantrace recognizing GTM as 3rd party... the problem is that GTM asynchronously fires tons of other 3rd party tags, which I'd need to individually identify and group. I guess Dynatrace should be able to identify which resource if launching the external tags.

How to get started

First steps in the forum
Read Community User Guide
Best practices of using forum

NAM 2019 SP5 is available


Check the RHEL support added in the latest NAM service pack.

Learn more

LIVE WEBINAR

"Performance Clinic - Monitoring as a Self Service with Dynatrace"


JANUARY 15, 3:00 PM GMT / 10:00 AM ET

Register here

Follow this Question

Answers Answers and Comments

32 People are following this question.

avatar image avatar image avatar image avatar image avatar image avatar image avatar image avatar image avatar image avatar image avatar image avatar image avatar image avatar image avatar image avatar image avatar image avatar image avatar image avatar image avatar image avatar image avatar image avatar image avatar image avatar image avatar image avatar image avatar image avatar image avatar image avatar image

Related Questions

Can I subtract values from different metrics on Dynatrace SaaS?

Meaning of all the server-side performance metrics in One Agent

Difference between webserver traffic and request count

Filter HTTP Request parameter in a Dashboard's tile

monitor windows services availability

Forum Tags

mobile monitoring dotnet iis chat kubernetes servicenow amazon web services feedback mysql mainframe application rules rest api cassandra dashboard oneagent sdk cmc application monitoring openkit smartscape request attributes monitoring developer community user tagging log monitoring services ufo activegate auto-detection high five award uem webserver usql iib test automation license ios news migration management zones ibm mq web services notifications sso host monitoring knowledge sharing reports browser monitors java hybris sap vmware maintenance window user action naming javascript appmon ai availability tipstricks automation extensions diagnostic tools session replay permissions search davis assistant auto-update faq documentation problem detection http monitors easytravel apdex network docker tags and metadata cloud foundry google cloud platform synthetic monitoring process groups account usability dynatrace saas gui paas openshift key user actions administration production user actions postgresql synthetic locations upgrade oneagent security Dynatrace Managed user management python technologies mongodb openstack user session monitoring continuous delivery citrix configuration alerting performance monitoring NGINX action naming linux nam installation error reporting database mission control apache mobileapp RUM php azure purepath davis scripting aix nodejs android
  • Forums
  • Public Forums
    • Community Connect
    • Dynatrace
      • Dynatrace Open Q&A
    • Application Monitoring & UEM
      • AppMon & UEM Open Q&A
    • Network Application Monitoring
      • NAM Open Q&A