Turn on suggestions
Auto-suggest helps you quickly narrow down your search results by suggesting possible matches as you type.
- Dynatrace Community
- Dynatrace
- Learn
- Dynatrace tips
- Is it possible to get datasource pool names without the need for tons of individual plugins for each one?
Options
- Subscribe to RSS Feed
- Mark Topic as New
- Mark Topic as Read
- Pin this Topic for Current User
- Printer Friendly Page
Is it possible to get datasource pool names without the need for tons of individual plugins for each one?
Options
- Mark as New
- Subscribe to RSS Feed
- Permalink
11 Sep 2019
11:31 PM
- last edited on
04 Sep 2023
10:19 AM
by
![]() MaciejNeumann
MaciejNeumann
I have created a JMX OneAgent plugin for our WebLogic 12.2 environment and while I am able to pull in metrics such as Active Connections Current Count, I can not seem to find a way to make Dynatrace show the data connection pool names.
See below for example. While it is telling me the metrical values, it's not saying what the pool name is.
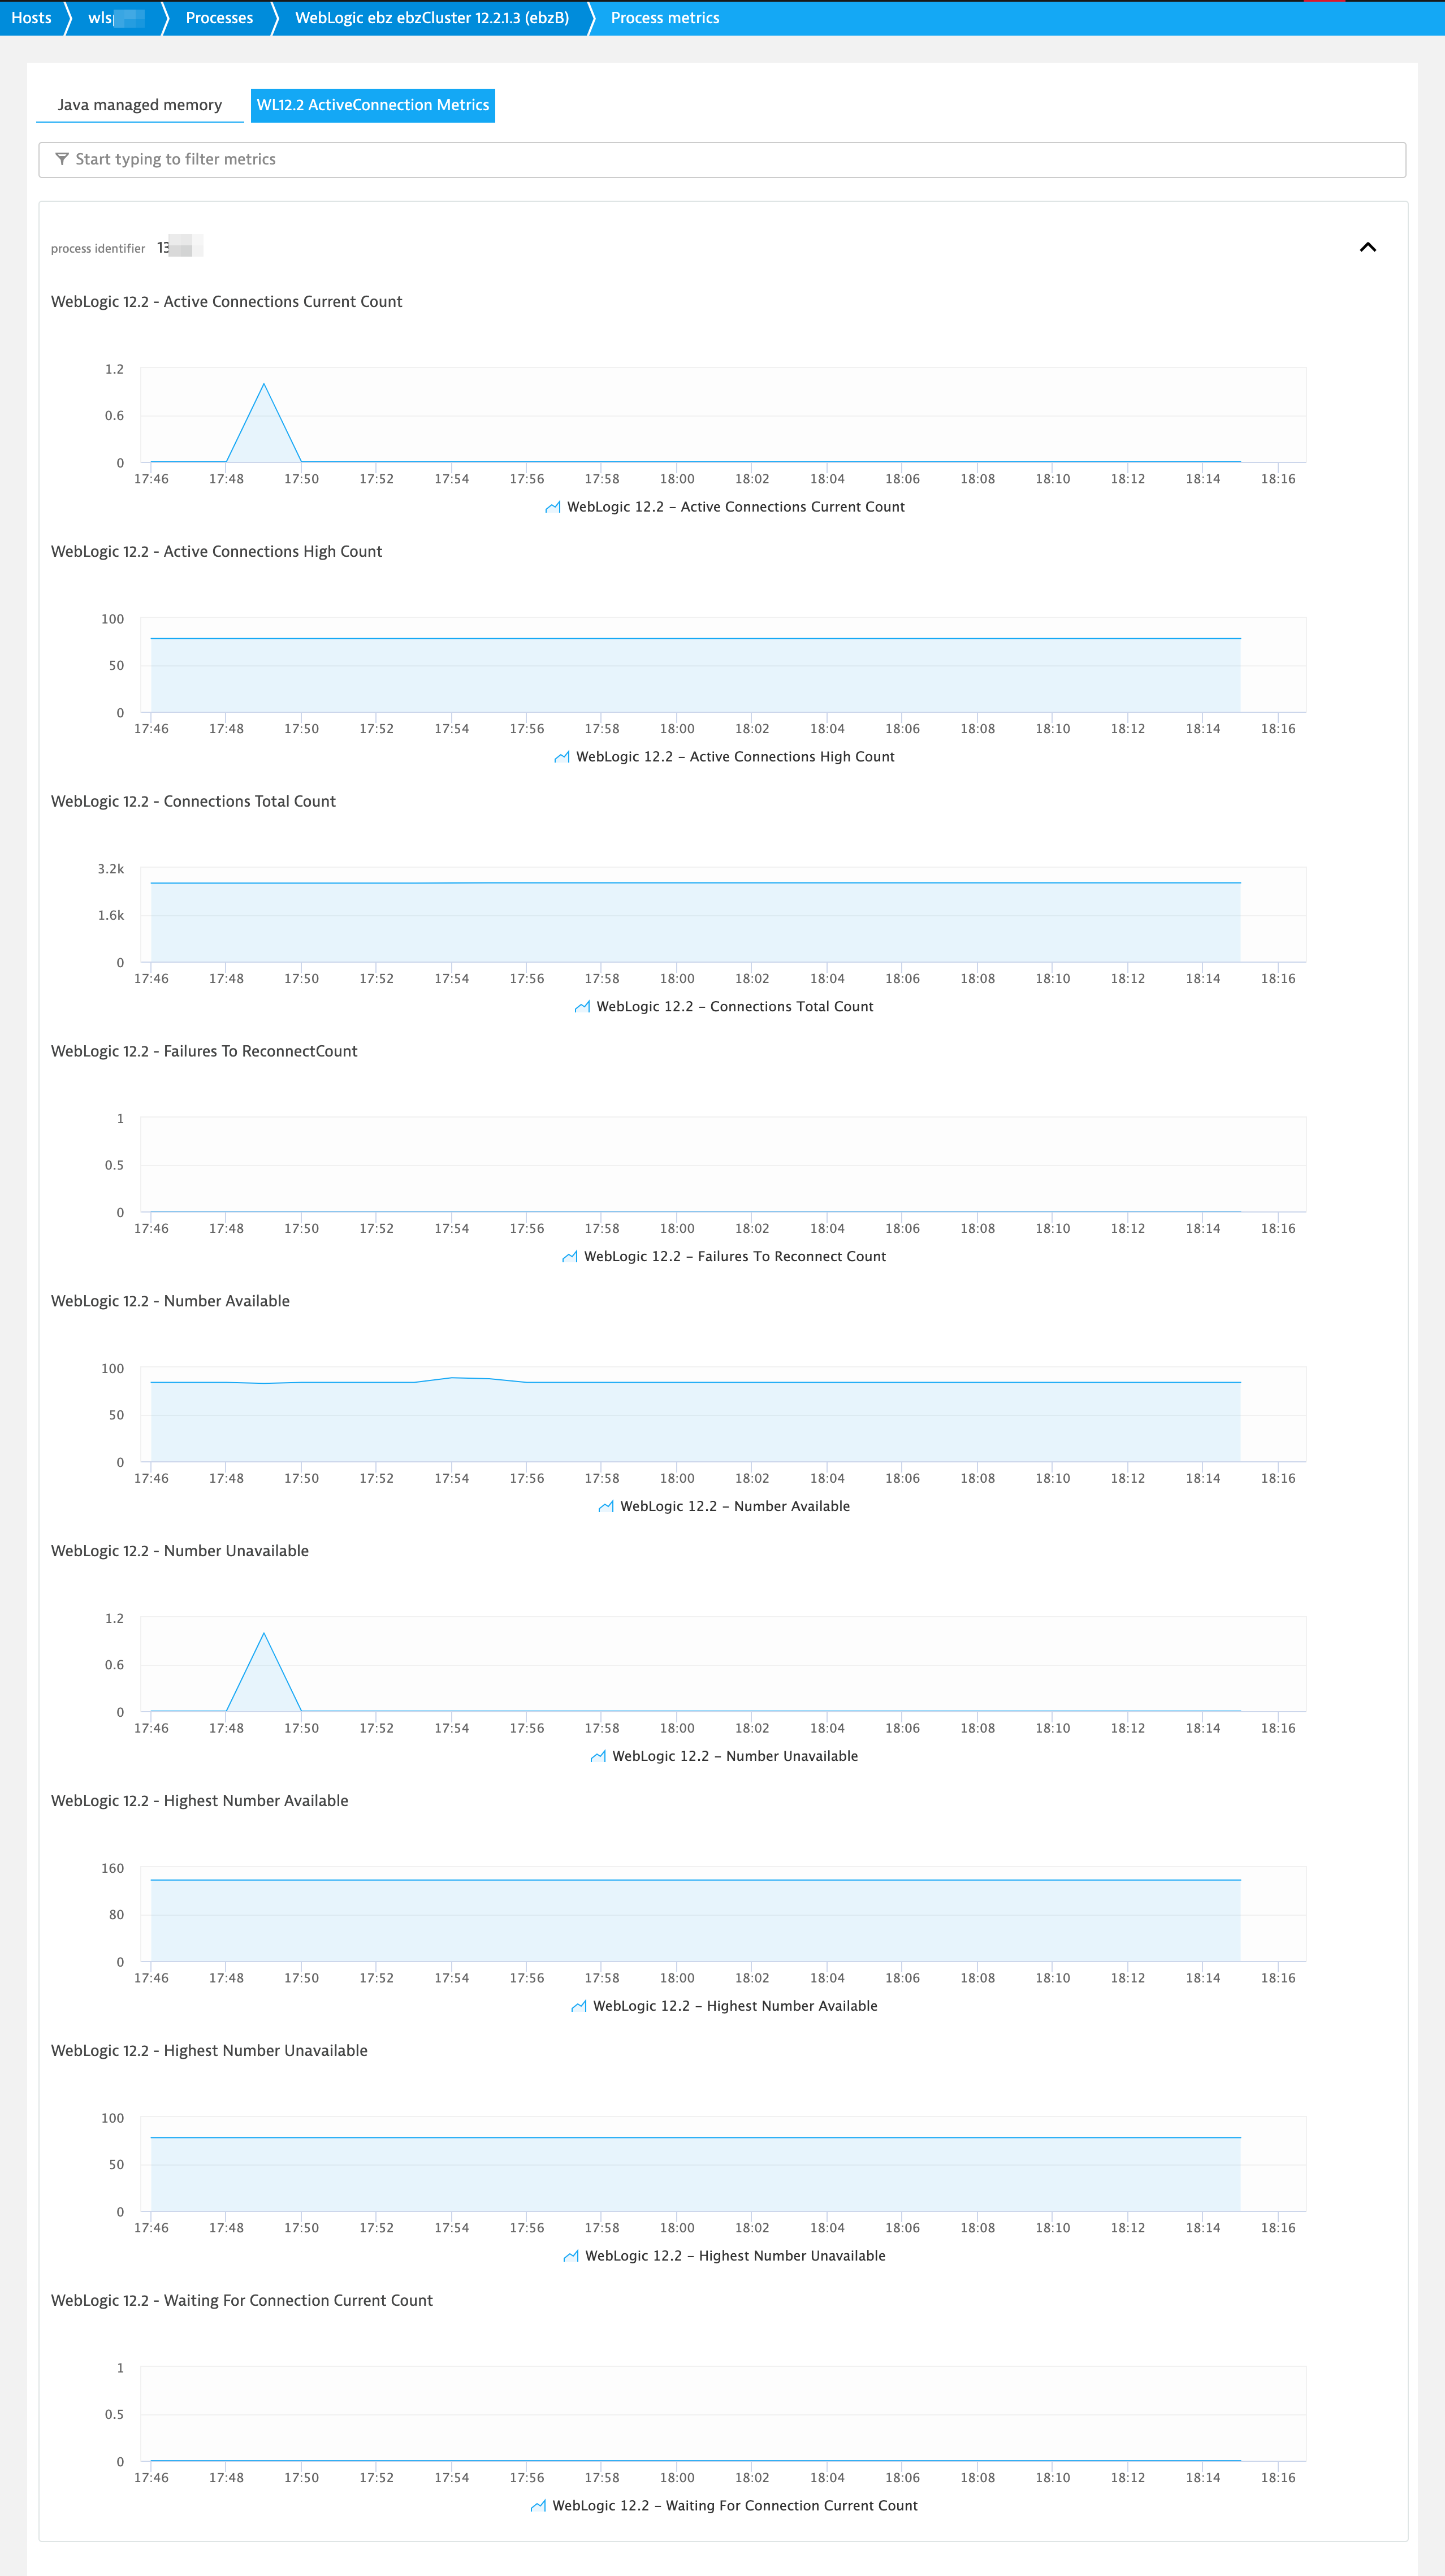
I know I could scope a single plugin down to an individual pool name, but then in order to get all of them within the WebLogic environment I would need 80 different plugins which is ridiculous so I really hope I am just missing something here.
Is it even possible?
Thanks!
Labels:
- Labels:
-
databases
-
extensions
-
oneagent
-
tips and tricks
1 REPLY 1
Options
- Mark as New
- Subscribe to RSS Feed
- Permalink
12 Sep 2019 12:26 AM
Hi, we faced the same issue.
I was actually looking how to add to a single plugin the different metrics and dimentios for all the DSources for the Active Connections Current Count and list each one with each name. We started with the default JSON and test to add specific DS Names, since that worked then we thought about using splitting. (https://github.com/Dynatrace/JMX-Extensions) and add the DS manually and get each needed dimension. We never tested to see if that even works.
Then we thought about using a python script to connect to the MBean and retrive the data (To avoid to edit the .json in case of new DSource).
But sadly, since the Davis Engine dont use such metrics to alert and only allows the custom alert, we stop testing it and just use a single plugin with the DS we need it, and use that metric to alert in another system.
Services Solution Engineer @PowerCloud - Observability/CloudOps Certified / Former SE @Dynatrace.
Reply
