• Forums
    • Public Forums
      • Community Connect
      • Dynatrace
        • Dynatrace Open Q&A
      • Application Monitoring & UEM
        • AppMon & UEM Open Q&A
      • Network Application Monitoring
        • NAM Open Q&A
  • Home
  • Public Forums
  • Dynatrace
  • Dynatrace Open Q&A
avatar image
Question by Enrico F. · Oct 04, 2019 at 12:46 PM · Dynatrace Managed alerting monitoring java

Custom alerts for individual tomcat thread pools

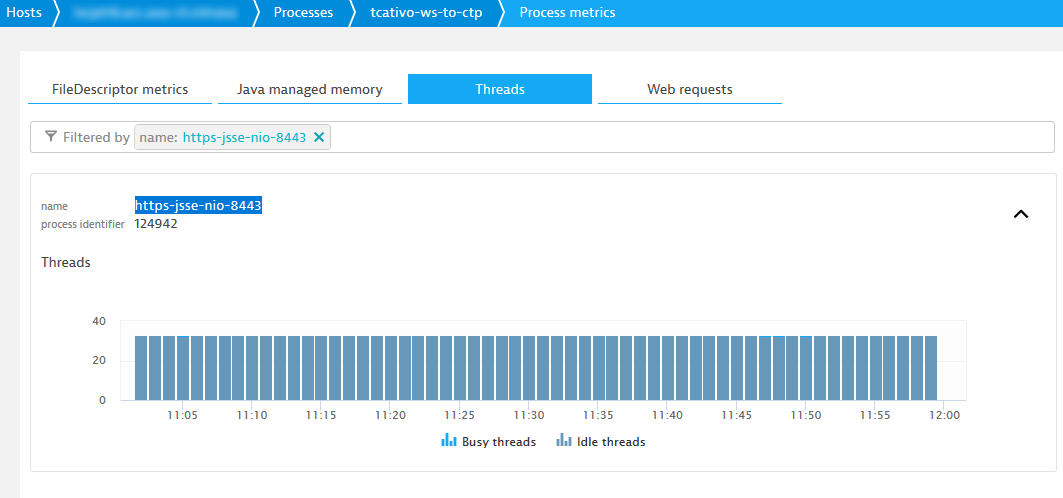
I would like to receive an alert when the number of busy threads in a specific thread pool reaches a fixed threshold.

I can see the thread pool in the process metrics - for example "https-jsse-nio-8443" as shown here:

However, it seems it's not possible to create a custom alert for the above thread pool alone as only the total is available as metric "Tomcat busy threads":

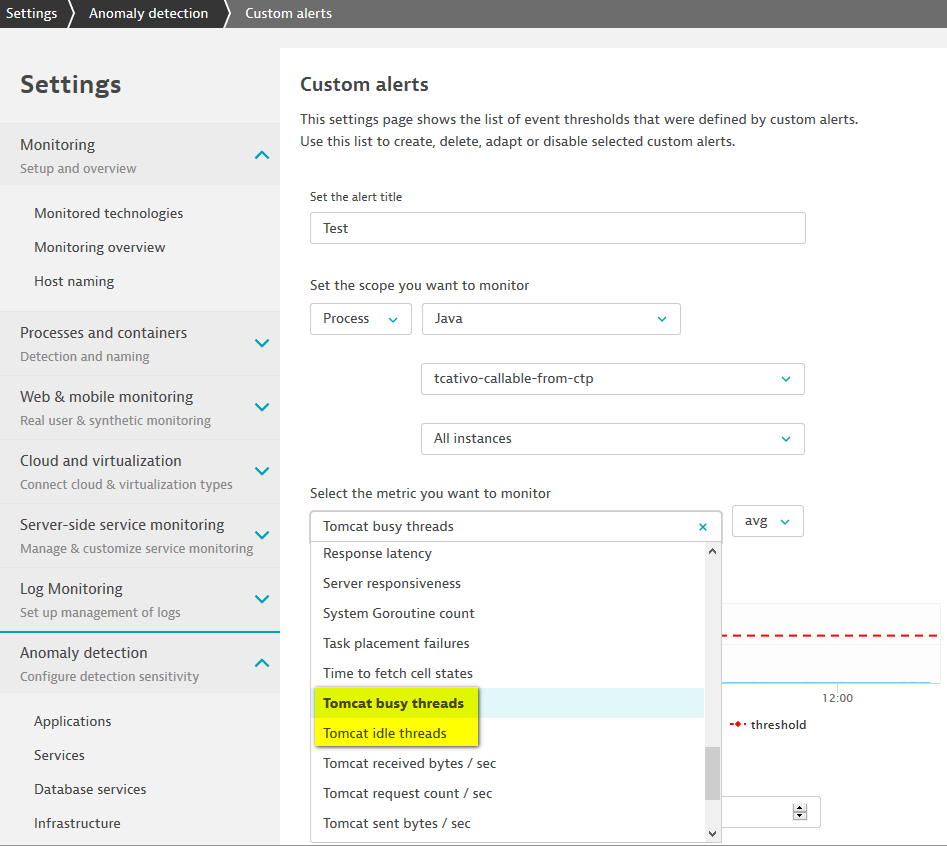
Is there any way around that or is that a known limitation and potential candidate for an RFE?

1570191402440.png (23.0 KiB)
1570191661875.png (46.1 KiB)
Comment

People who like this

0 Show 0
10 |2000000 characters needed characters left characters exceeded
  • Viewable by all users
  • Viewable by moderators
  • Viewable by moderators and the original poster
  • Advanced visibility
Toggle Comment visibility. Current Visibility: Viewable by all users

Up to 10 attachments (including images) can be used with a maximum of 50.0 MiB each and 250.0 MiB total.

2 Replies

  • Sort: 
  • Most voted
  • Newest
  • Oldest
avatar image
Best Answer

Answer by Wolfgang B. · Oct 04, 2019 at 01:10 PM

Hi Enrico,

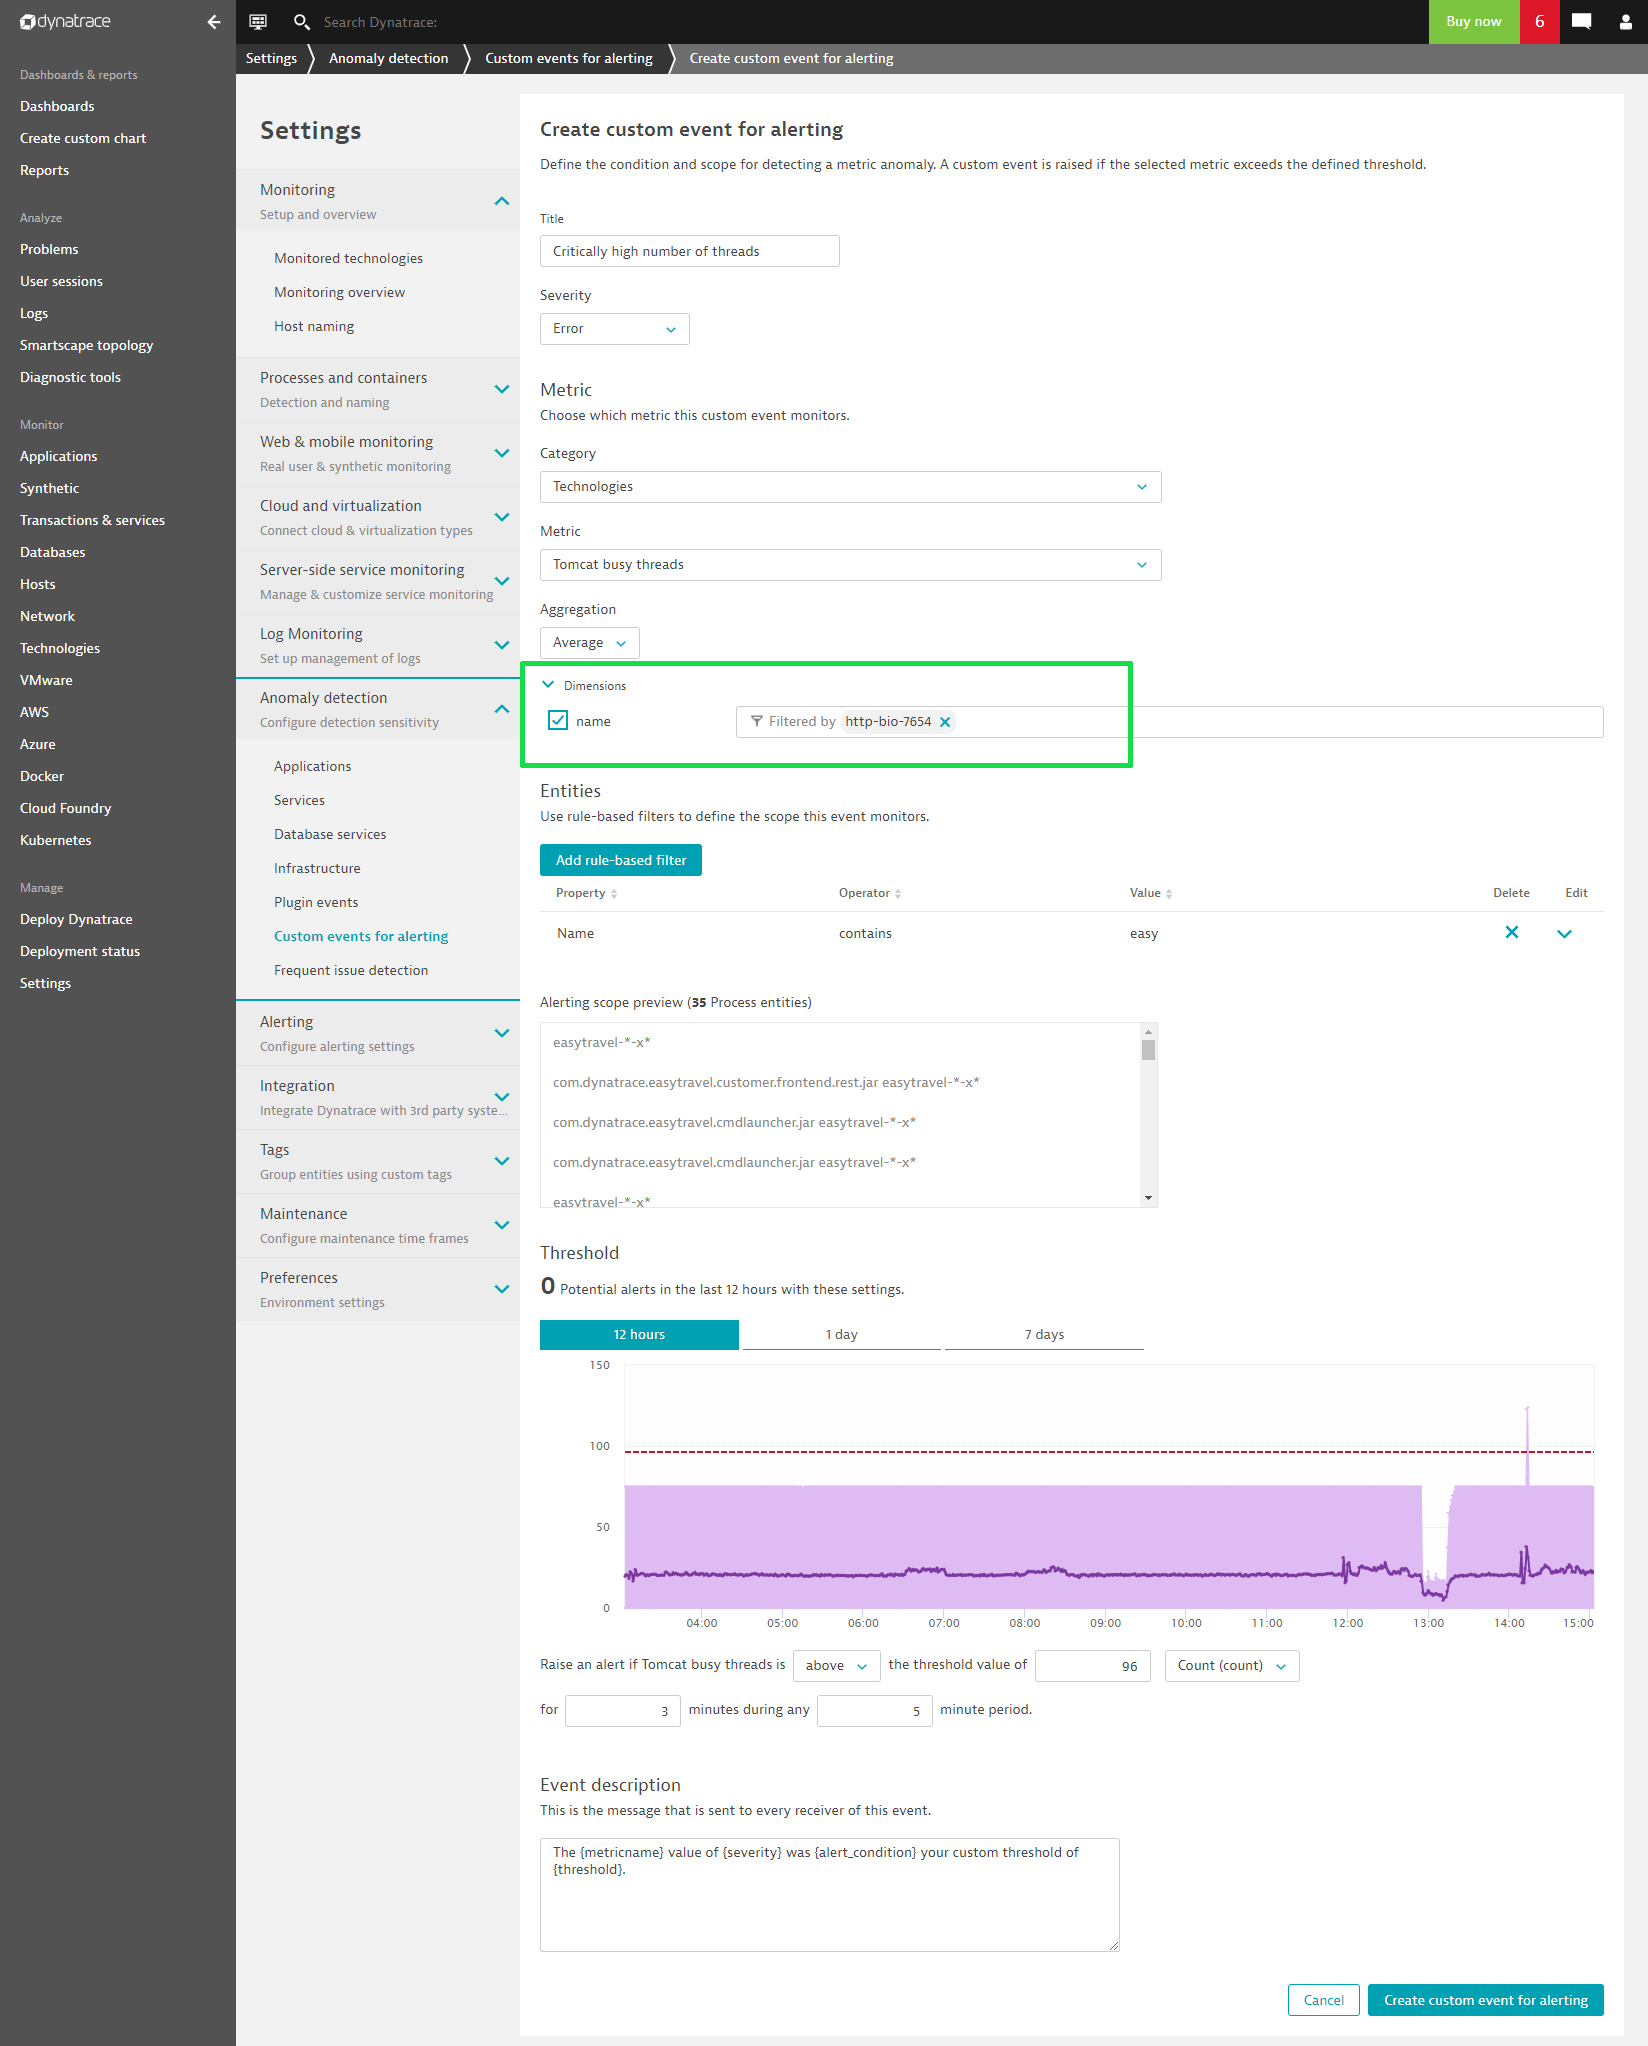
You will love this upcoming feature. Its already pretty close to general availability. Will be available in release 179 (Dynatrace SaaS) and 180 Dynatrace Managed.

Best greetings,

Wolfgang


nut64827devdynatracelabscom-5.png (192.9 KiB)
Comment
Sebastian K.

People who like this

1 Show 2 · Share
10 |2000000 characters needed characters left characters exceeded
  • Viewable by all users
  • Viewable by moderators
  • Viewable by moderators and the original poster
  • Advanced visibility
Toggle Comment visibility. Current Visibility: Viewable by all users

Up to 10 attachments (including images) can be used with a maximum of 50.0 MiB each and 250.0 MiB total.

avatar image Sebastian K. · Oct 04, 2019 at 01:16 PM 0
Share

Cool! Super handy thing ;)

avatar image Enrico F. · Oct 04, 2019 at 01:21 PM 0
Share

Hi Wolfgang,

That's the feature I expected to see from the start - so yes, definitely looking forward :)

Thanks for the feedback!

avatar image

Answer by Sebastian K. · Oct 04, 2019 at 01:10 PM

The only workaround you can do is push information about thread pools state to dynatrace, and there are some options for that:

  • Expose them via JMX -> then you can create custom JMX plugin. This will create custom metrics and on them you can setup static thresholds / custom alerts -> https://www.dynatrace.com/news/blog/jmx-plugins-editor-now-available-eap/ and for thresholds api -> https://www.dynatrace.com/support/help/extend-dynatrace/dynatrace-api/environment-api/thresholds/put-threshold/
  • Create OneAgent plugin -> you can write simple python plugin that will collect those metrics from tomcats and send them to Dynatrace as Custom Metrics
  • Use Dynatrace timeseries API -> you can create dynatrace agnostic solution that will fetch such metrics to dynatrace via rest api as custom metrics.

I think best option will be the first one.

Sebastian

Comment

People who like this

0 Show 1 · Share
10 |2000000 characters needed characters left characters exceeded
  • Viewable by all users
  • Viewable by moderators
  • Viewable by moderators and the original poster
  • Advanced visibility
Toggle Comment visibility. Current Visibility: Viewable by all users

Up to 10 attachments (including images) can be used with a maximum of 50.0 MiB each and 250.0 MiB total.

avatar image Enrico F. · Oct 04, 2019 at 01:23 PM 0
Share

Hi Sebastian.

I'll reate a JMX plugin then to have this covered until 180 is pushed to our cluster.

Thanks!

How to get started

First steps in the forum
Read Community User Guide
Best practices of using forum

NAM 2019 SP5 is available


Check the RHEL support added in the latest NAM service pack.

Learn more

LIVE WEBINAR

"Performance Clinic - Monitoring as a Self Service with Dynatrace"


JANUARY 15, 3:00 PM GMT / 10:00 AM ET

Register here

Follow this Question

Answers Answers and Comments

35 People are following this question.

avatar image avatar image avatar image avatar image avatar image avatar image avatar image avatar image avatar image avatar image avatar image avatar image avatar image avatar image avatar image avatar image avatar image avatar image avatar image avatar image avatar image avatar image avatar image avatar image avatar image avatar image avatar image avatar image avatar image avatar image avatar image avatar image avatar image avatar image avatar image

Related Questions

Anomaly Detection setting not visible under Process Group settings

How can I get the JMX metrics from weblogic ?

Server 1 activated Adaptive Load Reduction?

Custom service to monitor Tableau batch jobs?

How to alert for java thread counts?

Forum Tags

mobile monitoring dotnet iis chat kubernetes servicenow amazon web services feedback mysql mainframe application rules rest api cassandra dashboard oneagent sdk cmc application monitoring openkit smartscape request attributes monitoring developer community user tagging log monitoring services ufo activegate auto-detection high five award uem webserver usql iib test automation license ios news migration management zones ibm mq web services notifications sso host monitoring knowledge sharing reports browser monitors java hybris sap vmware maintenance window user action naming javascript appmon ai availability tipstricks automation extensions diagnostic tools session replay permissions search davis assistant auto-update faq documentation problem detection http monitors easytravel apdex network docker tags and metadata cloud foundry google cloud platform synthetic monitoring process groups account usability dynatrace saas gui paas openshift key user actions administration production user actions postgresql synthetic locations upgrade oneagent security Dynatrace Managed user management python technologies mongodb openstack user session monitoring continuous delivery citrix configuration alerting performance monitoring NGINX action naming linux nam installation error reporting database mission control apache mobileapp RUM php azure purepath davis scripting aix nodejs android
  • Forums
  • Public Forums
    • Community Connect
    • Dynatrace
      • Dynatrace Open Q&A
    • Application Monitoring & UEM
      • AppMon & UEM Open Q&A
    • Network Application Monitoring
      • NAM Open Q&A