Turn on suggestions
Auto-suggest helps you quickly narrow down your search results by suggesting possible matches as you type.
- Dynatrace Community
- Dynatrace
- Ask
- Open Q&A
- error log chart
Options
- Subscribe to RSS Feed
- Mark Topic as New
- Mark Topic as Read
- Pin this Topic for Current User
- Printer Friendly Page
Options
- Mark as New
- Subscribe to RSS Feed
- Permalink
14 Jan 2020 09:49 AM
We are looking for a way to see the total number of ERROR and WARN Logs e.g. per Minute. The "HTTP 5xx errors" chart does not fit for one of our applications, as this application has no direct user interaction via HTTP but is rather fed by consuming Kafka.
Currently we have to look into Kibana but we would rather have a direct indication on our Dynatrace Dashboard, when the number of error logs increases.
Do you have any suggestions?
Solved! Go to Solution.
Labels:
- Labels:
-
log monitoring classic
1 REPLY 1
Options
- Mark as New
- Subscribe to RSS Feed
- Permalink
14 Jan 2020 10:29 AM
Hi Matthias,
considering the current state of the product:
It is currently possible to subscribe a custom metric based on the occurrence of log messages matching a specific query. Therefore a metric like this can be created:
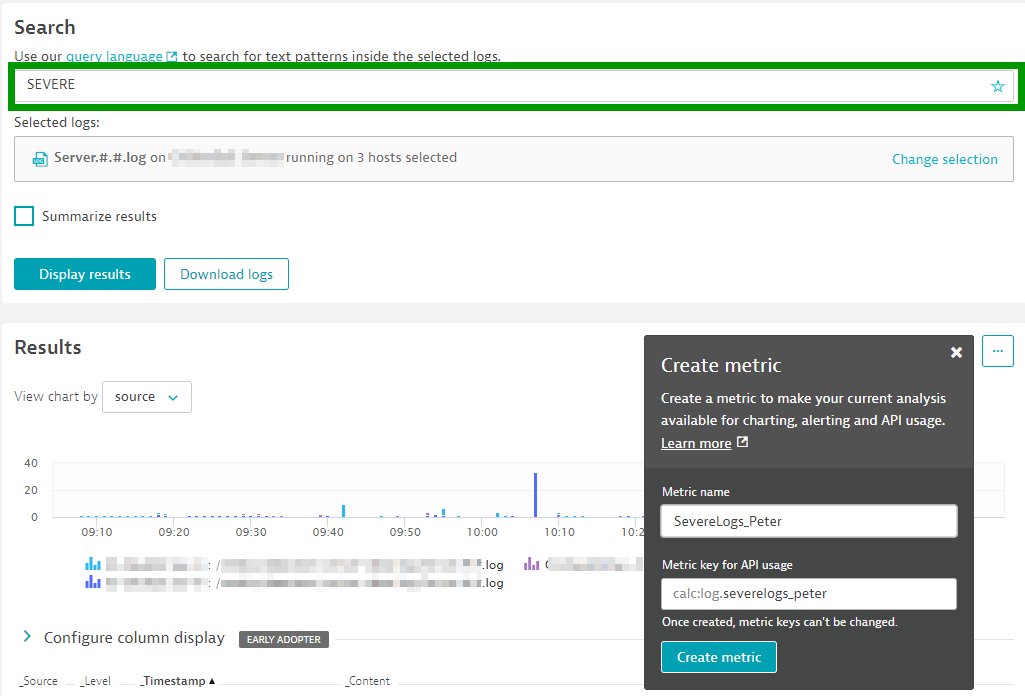
The metric will show the count of of loglines matching the "SEVERE" query split by Log filepath and Process. Currently it is a contains() search so there might be false positives as "SEVERE" could also appear somewhere in the log message. That will be enhanced in the future by adding dimensions to the metric such as the log level, which will then omit false positives.
So to achieve your use case, two metrics would be needed. One counting loglines matching "ERROR" and an additional one matching "WARNING". Of course these metrics are available for charting and dashboarding.
The logfiles intended for this monitoring use case have to be stored within Dynatrace as a precondition.
Best, Peter
Reply
