Turn on suggestions
Auto-suggest helps you quickly narrow down your search results by suggesting possible matches as you type.
- Dynatrace Community
- Dynatrace
- Ask
- Real User Monitoring
- Web application API responding slow
Options
- Subscribe to RSS Feed
- Mark Topic as New
- Mark Topic as Read
- Pin this Topic for Current User
- Printer Friendly Page
Options
- Mark as New
- Subscribe to RSS Feed
- Permalink
03 Feb 2020 03:02 PM
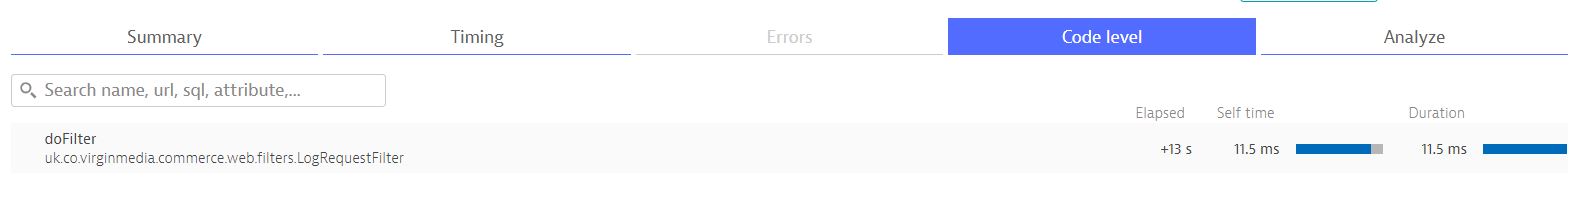
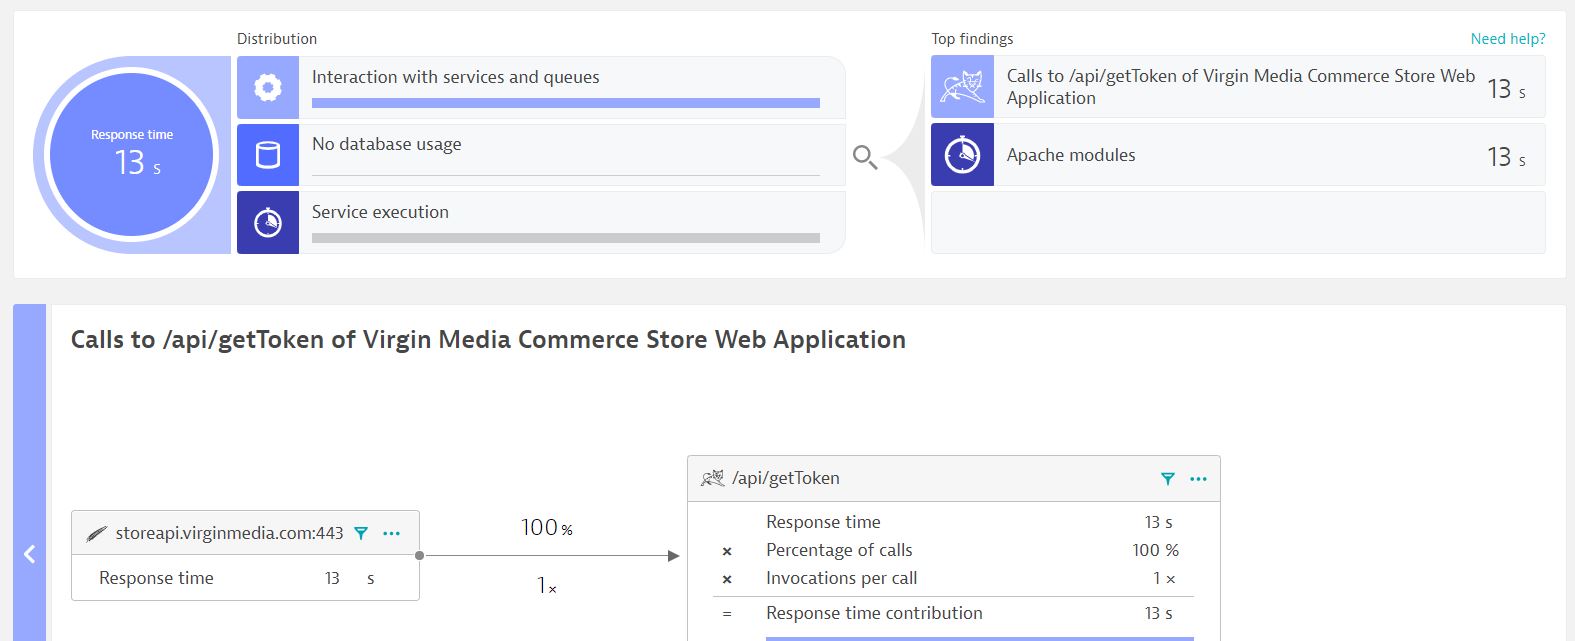
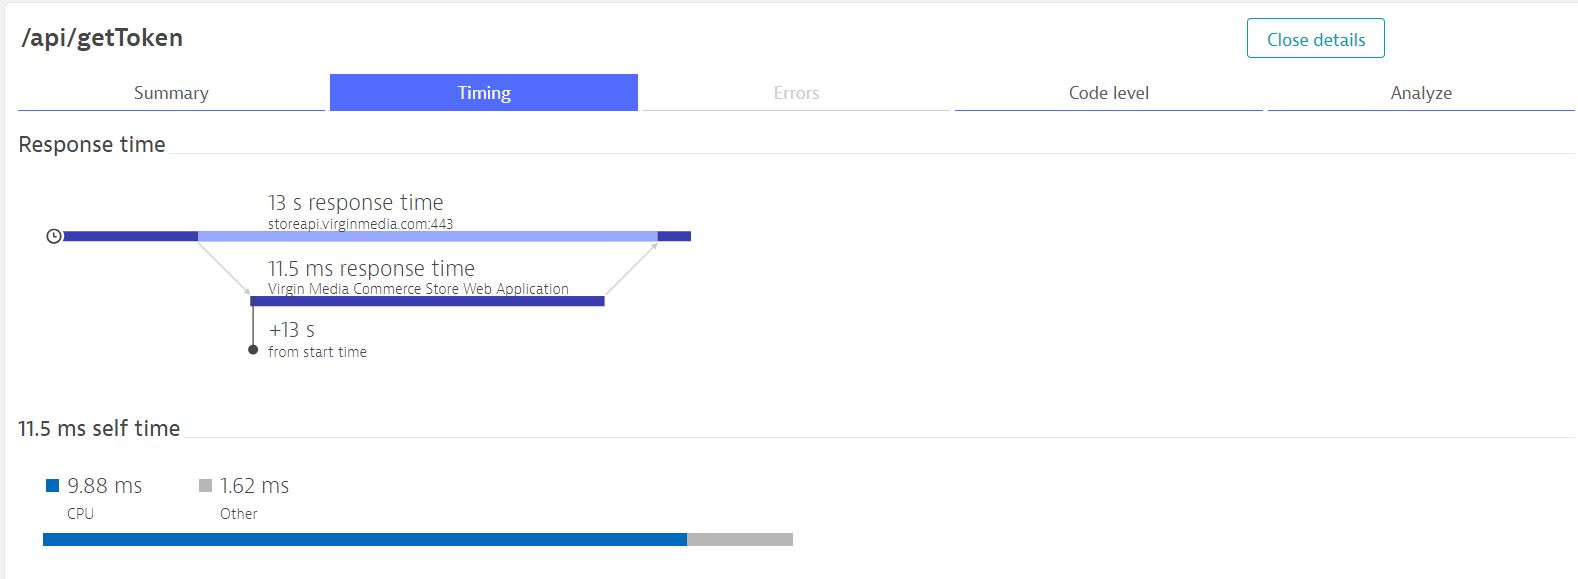
Hi, I have a web application which has 4 Apache and 4 Tomcat servers. I am trying to find the root cause for it using Purepath in Dynatrace but I am not able to figure it out yet. I have attached 3 screenshots where I am trying to understand what each of these means. If someone can have a look and help, that would be very helpful.
In the 2nd screenshot it says, Elapsed time, selftime and duration - what does these mean? Does it mean that the doFilter method took 13 seconds of time?
The flow is Browser -> Apache -> Tomcat so I am trying to find out where exactly is the problem?
Solved! Go to Solution.
Labels:
3 REPLIES 3
Options
- Mark as New
- Subscribe to RSS Feed
- Permalink
03 Feb 2020 03:08 PM
In a nutshell:
Elapsed: When the method started
Self: Time spent in the method itself
Duration: Time spent in downstream calls made and the method itself (total response time)
Options
- Mark as New
- Subscribe to RSS Feed
- Permalink
03 Feb 2020 03:34 PM
@Dave M. Thanks for the response Dave. Would it be possible for you to analyse anything from those images and screenshots?
I am trying to find out the root cause for that 13 seconds time but I am not sure where to start and what to find?
If you can help, that would be very much appreciated.
Options
- Mark as New
- Subscribe to RSS Feed
- Permalink
03 Feb 2020 03:54 PM
Can you send me your tenant or cluster details via email at dave dot mauney at dynatrace.com?
Reply
