• Forums
    • Public Forums
      • Community Connect
      • Dynatrace
        • Dynatrace Open Q&A
      • Application Monitoring & UEM
        • AppMon & UEM Open Q&A
      • Network Application Monitoring
        • NAM Open Q&A
  • Home
  • Public Forums
  • Dynatrace
  • Dynatrace Open Q&A
avatar image
Question by Konstantin M. · Feb 17, 2020 at 09:02 AM · dashboard monitoring database services tags and metadata

Monitor the max DB response time of Database

Hi All,

I want to monitor the max response time of a database and the result should be visualized on a tile within Dashboard. How can I create the custom metric and push it to specific management zones?

So far I think to apply an automatic tagging rule which will put all the database under the same tag "DB ALL". That will allow me to filter the custom chart only for the specific services. Next step is to create the custom metric for the service and pin it as a tile to the dashboard dedicated for DB.

Cheers,
Konstantin

Comment

People who like this

0 Show 0
10 |2000000 characters needed characters left characters exceeded
  • Viewable by all users
  • Viewable by moderators
  • Viewable by moderators and the original poster
  • Advanced visibility
Toggle Comment visibility. Current Visibility: Viewable by all users

Up to 10 attachments (including images) can be used with a maximum of 50.0 MiB each and 250.0 MiB total.

1 Reply

  • Sort: 
  • Most voted
  • Newest
  • Oldest
avatar image
Best Answer

Answer by Sebastian K. · Feb 17, 2020 at 09:07 AM

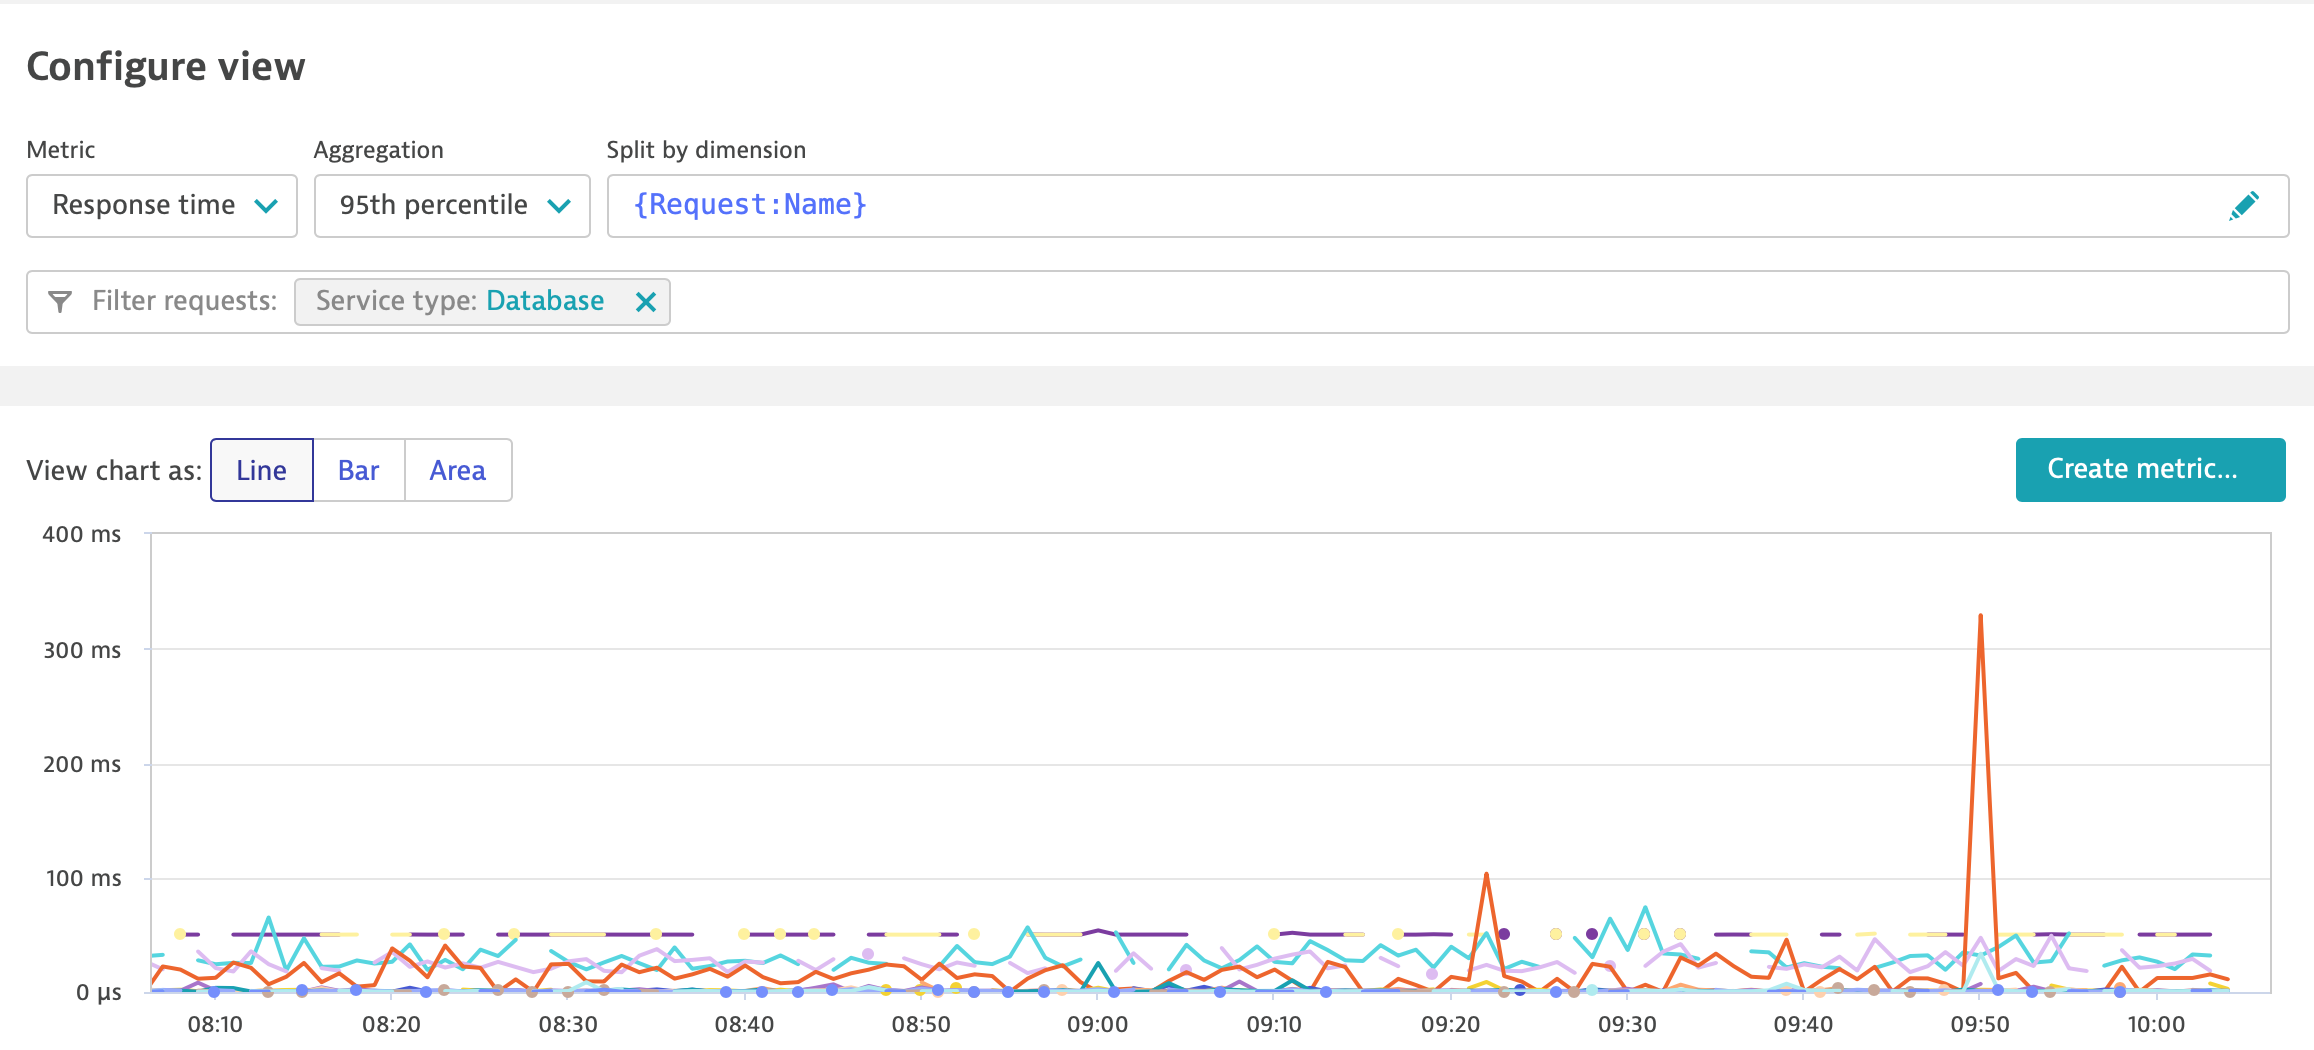
You don't need tag, you can just pick service type, Database, pick 95th percentile agregation to have slowest executions and than you can create metric based on this. Unfortunately there is no 99th percentile or max value.

Sebastian


1581930393497.png (231.9 KiB)
Comment
Dallas P.

People who like this

1 Show 2 · Share
10 |2000000 characters needed characters left characters exceeded
  • Viewable by all users
  • Viewable by moderators
  • Viewable by moderators and the original poster
  • Advanced visibility
Toggle Comment visibility. Current Visibility: Viewable by all users

Up to 10 attachments (including images) can be used with a maximum of 50.0 MiB each and 250.0 MiB total.

avatar image Konstantin M. · Feb 17, 2020 at 09:26 AM 0
Share

Thanks a lot for the hint but how exactly can I create the custom metric?

avatar image Sebastian K. Konstantin M. · Feb 17, 2020 at 09:56 AM 0
Share

Use button that you can see on screen "Create metric....". After finish the process you will be able to chart it on custom chart. Remember that each DB statement will consume 1 custom metric from license. So if you will have 100 queries, each will be count as new dimension, and each will be consuming license. In such case you will have to use 100 custom metrics from your license.

And my bad, you cannot use percentile and service type as a filter when you are creating metric. You will have to do this via tag or management zone.

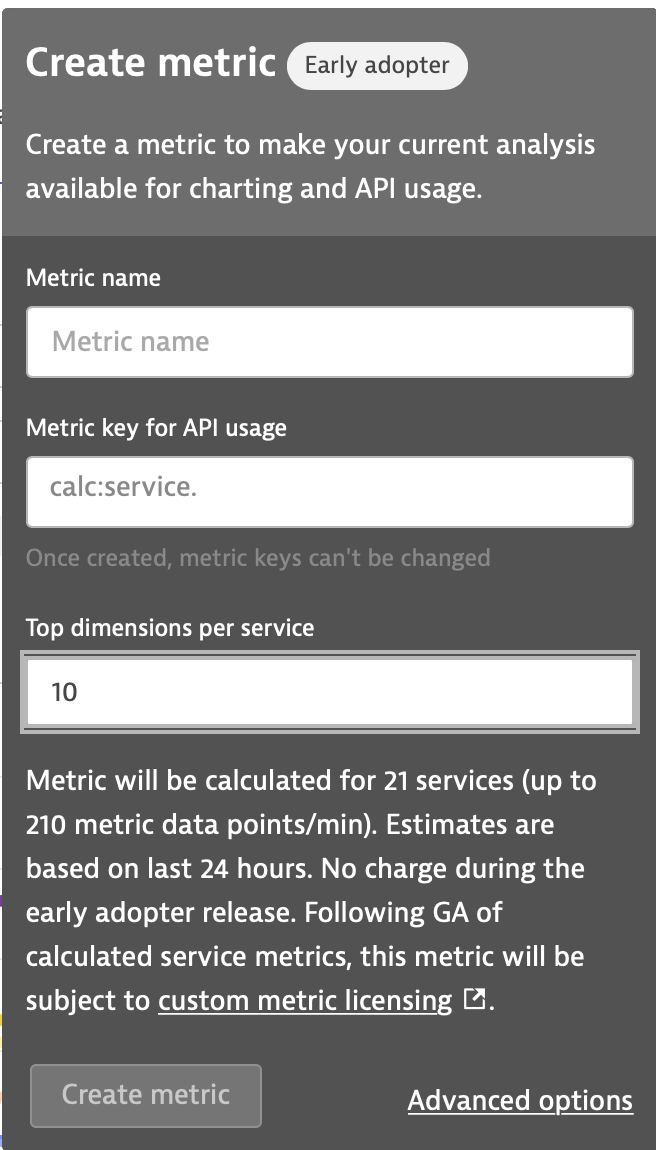
you will see there this guy, you will have to pick top X number of statements you wish to monitor. You should be able than to change aggregation on metric itself after creation to see max or percentile.

Sebastian

1581933356357.png (117.6 KiB)

How to get started

First steps in the forum
Read Community User Guide
Best practices of using forum

NAM 2019 SP5 is available


Check the RHEL support added in the latest NAM service pack.

Learn more

LIVE WEBINAR

"Performance Clinic - Monitoring as a Self Service with Dynatrace"


JANUARY 15, 3:00 PM GMT / 10:00 AM ET

Register here

Follow this Question

Answers Answers and Comments

28 People are following this question.

avatar image avatar image avatar image avatar image avatar image avatar image avatar image avatar image avatar image avatar image avatar image avatar image avatar image avatar image avatar image avatar image avatar image avatar image avatar image avatar image avatar image avatar image avatar image avatar image avatar image avatar image avatar image avatar image

Related Questions

Collect data for service level agreement to meet metrics

Automatically applied tagging rule for database services

Pattern in key request

Could Dynatrace pull FogLight for Database metric to show on Dynatrace dashboard?

Charting a web application overall hotspots and DB Timings

Forum Tags

mobile monitoring dotnet iis chat kubernetes servicenow amazon web services feedback mysql mainframe application rules rest api cassandra dashboard oneagent sdk cmc application monitoring openkit smartscape request attributes monitoring developer community user tagging log monitoring services ufo activegate auto-detection high five award uem webserver usql iib test automation license ios news migration management zones ibm mq web services notifications sso host monitoring knowledge sharing reports browser monitors java hybris sap vmware maintenance window user action naming javascript appmon ai availability tipstricks automation extensions diagnostic tools session replay permissions search davis assistant auto-update faq documentation problem detection http monitors easytravel apdex network docker tags and metadata cloud foundry google cloud platform synthetic monitoring process groups account usability dynatrace saas gui paas openshift key user actions administration production user actions postgresql synthetic locations upgrade oneagent security Dynatrace Managed user management python technologies mongodb openstack user session monitoring continuous delivery citrix configuration alerting performance monitoring NGINX action naming linux nam installation error reporting database mission control apache mobileapp RUM php azure purepath davis scripting aix nodejs android
  • Forums
  • Public Forums
    • Community Connect
    • Dynatrace
      • Dynatrace Open Q&A
    • Application Monitoring & UEM
      • AppMon & UEM Open Q&A
    • Network Application Monitoring
      • NAM Open Q&A