Turn on suggestions
Auto-suggest helps you quickly narrow down your search results by suggesting possible matches as you type.
- Dynatrace Community
- Dynatrace
- Ask
- Open Q&A
- Database statements sorting
Options
- Subscribe to RSS Feed
- Mark Topic as New
- Mark Topic as Read
- Pin this Topic for Current User
- Printer Friendly Page
Options
- Mark as New
- Subscribe to RSS Feed
- Permalink
03 Feb 2016 08:04 PM
What exactly does sort by "total time" mean? What is the difference between "total time" and "response time"
Solved! Go to Solution.
Labels:
- Labels:
-
databases
7 REPLIES 7
Options
- Mark as New
- Subscribe to RSS Feed
- Permalink
03 Feb 2016 08:28 PM
Daniel,
This is a question we get quite a bit. Let me see if I can help.
Response time is the median response time for all executions of a certain statement withing a measurement period. So if you have a response time of 40 ms/minute for your analysis period, it means half of you statement ran in 40ms or less.
Total time is (loosely) calculated as response time * # of Executions. This is in order to show the weighted impact of execution counts. So a statement with low response time that is executed 1,000's of time in the period can have a quite high total time, and consume a large portion of resources.
Options
- Mark as New
- Subscribe to RSS Feed
- Permalink
03 Feb 2016 08:37 PM
Thank you for the fast reply. But I am still confused. How does this all fit together if I get the following analysis results. Could you please help me to interpret them.
Executions: 4.27/min
Total time: 23.6s/min
Response time: 1.61 min
Options
- Mark as New
- Subscribe to RSS Feed
- Permalink
03 Feb 2016 08:38 PM
sorry, pasting the table did not work. These are the numbers:
Executions: 4.27/min
Total time: 23.6s/min
Response time: 1.61 min
Options
- Mark as New
- Subscribe to RSS Feed
- Permalink
03 Feb 2016 09:24 PM
I see your issue. I have attached a screen shot here to illustrate your point.
This is what I meant by the term "loosely". The numbers show the relative relationships, but won't tie out if you try and apply an equation.
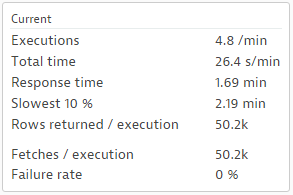
These numbers are over a 30 minute sample, so it's tempting to try something like this:
(Total Time *30) / (Executions*30) = Response time (normalized to seconds). But since these numbers are based on medians over the period, it won't tie out
So the best use case for the numbers is relative sort. You can find the most executed statement, the statement that takes the longest per execution (Response Time), and the statement that takes the most time in database (Total Time). Once you find the statement, you can tune it in the DB tool of choise, and test with some binds.
PS: The fetches look unusual too. 50 thousand rows fetched one row at a time? Could be the DISTINCT
Reply
Options
- Mark as New
- Subscribe to RSS Feed
- Permalink
04 Feb 2016 08:41 AM
Thank you for clarification.
One more question: Could you please explain what you meant by the "fetches look unusual too".
Options
- Mark as New
- Subscribe to RSS Feed
- Permalink
04 Feb 2016 09:21 AM
The fetch count indicates how often the application requests data from the database. Ideally you have one - or a few - fetches per execution. In your case it seems to be 50.000 per execution. This means you have 50.000 network round trips.
Reply
Options
- Mark as New
- Subscribe to RSS Feed
- Permalink
04 Feb 2016 01:22 PM
Understood. Thank you for the support!
