Turn on suggestions
Auto-suggest helps you quickly narrow down your search results by suggesting possible matches as you type.
- Dynatrace Community
- Dynatrace
- Ask
- Alerting
- Dynatrace Managed and alterting/notification
Options
- Subscribe to RSS Feed
- Mark Topic as New
- Mark Topic as Read
- Pin this Topic for Current User
- Printer Friendly Page
Options
- Mark as New
- Subscribe to RSS Feed
- Permalink
05 Dec 2017 12:42 PM
Hi again,
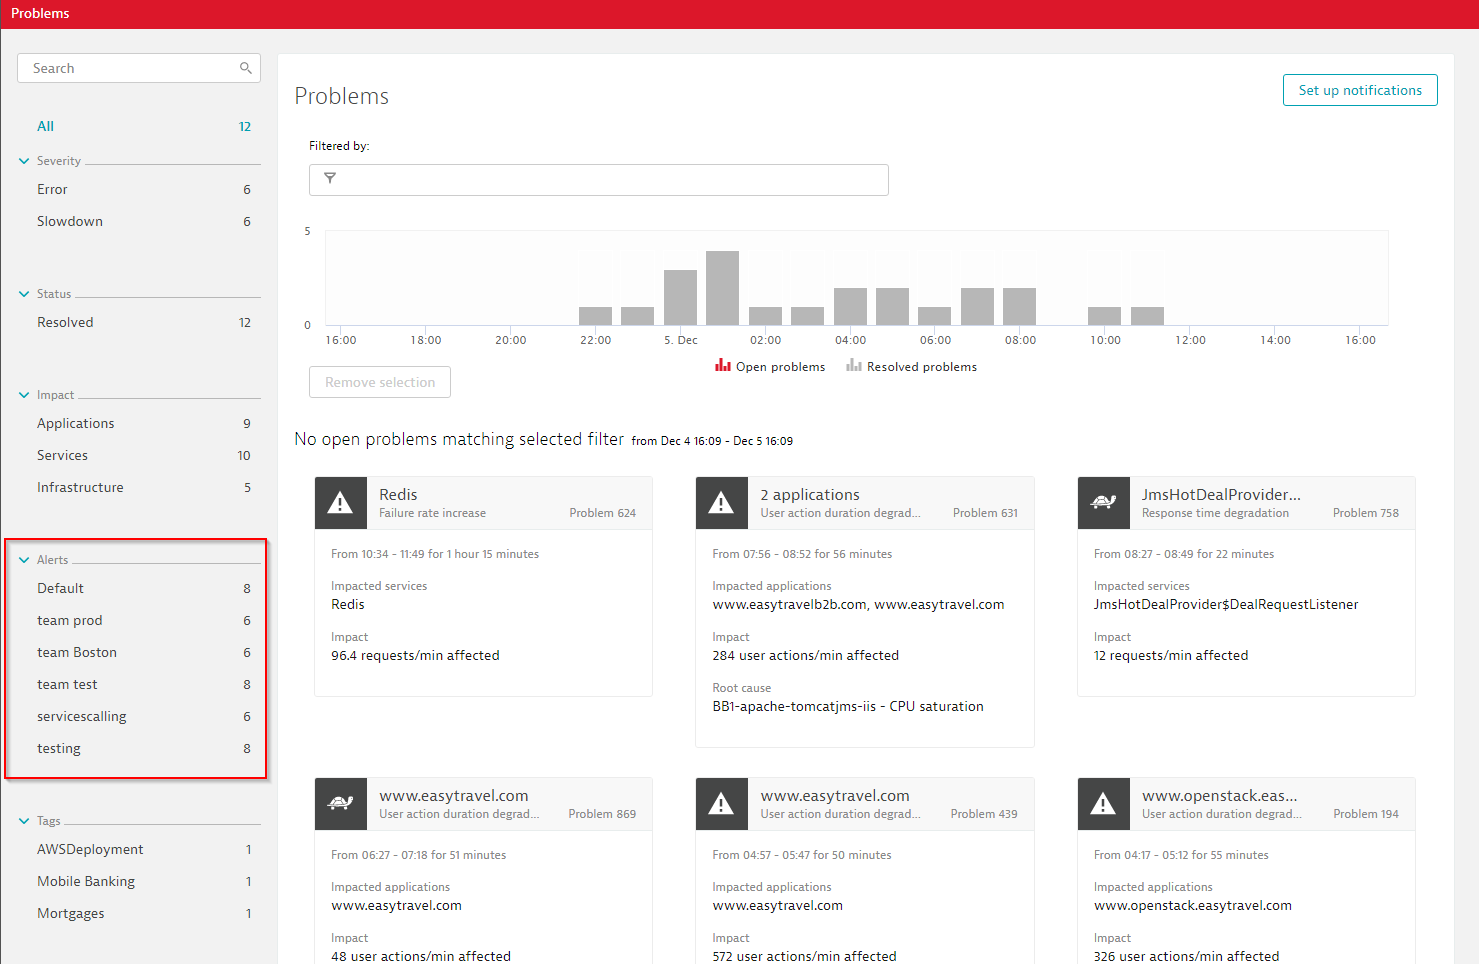
we notice, that the Dynatrace Managed WUI shows a number X in the red square in the upper right and the "Problem view" shows many more active alerts.
Where does the difference come from?
I'm asking, because I reverted all configurations I made in the alerting (creating profiles based on tags, etc pp) but I see in the square, that we have three alerts and going to "Problems" by the lefthanded navigation pane I see 6 (in this time).
Am I able to configure this behavior?
Thank you in advance.
Best,
Jan
Solved! Go to Solution.
Labels:
- Labels:
-
alerting
-
dynatrace managed
5 REPLIES 5
Options
- Mark as New
- Subscribe to RSS Feed
- Permalink
05 Dec 2017 03:13 PM
The red problem/alert indicator in the top right corner of the screen represents your personal alert count that is defined for your 'Alerting profile'. Within the problems feed you get a pretty good overview on how many alerts were sent out for each profile. A profile represents a severity and tag problem filter that defines which problems are sent out as alerts.
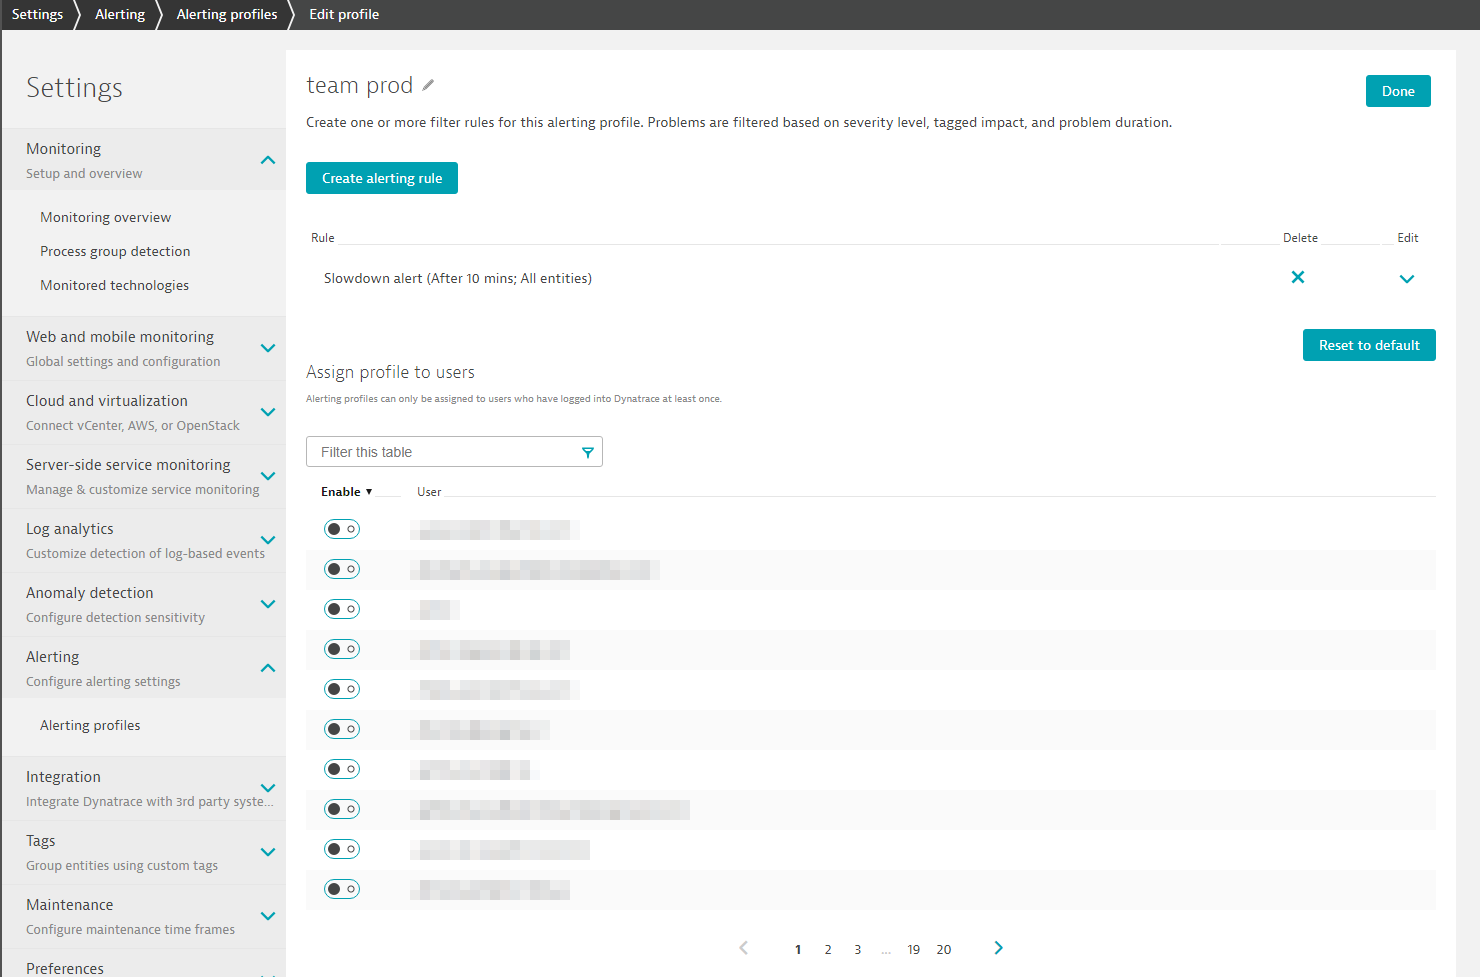
Below an alerting profile you can enable that profile for a specific user, which will then be used within the mobile app and within the red alerting indicator.
See screenshots below:
Reply
Options
- Mark as New
- Subscribe to RSS Feed
- Permalink
06 Dec 2017 03:42 PM
Hi @Wolfgang B.,
thank you for your reply. I thought right, that the indicator depends on the alerting profiles.
I do not configured any alerting profile yet or I deleted the ones I had. So I expect, that the alert number in the indicator should fit the number of open problems in the view. Is that right?
If not, why?
Did I miss some documentation here?
Best
Jan.
Options
- Mark as New
- Subscribe to RSS Feed
- Permalink
06 Dec 2017 03:49 PM
Every user automatically has an alerting profile assigned. If you deleted all your profiles there is still the default profile available where your user is falling into. Even within the default profile we have some standard filters applied, such as that we filter out slowdown problems that are not longer than 30min. You can easily change that default profile for all your users (redefining the default).
If you choose to alert on everything immediately your red indicator number will be the same as your problem feed shows.
Reply
Options
- Mark as New
- Subscribe to RSS Feed
- Permalink
06 Dec 2017 04:10 PM
Hi @Wolfgang B.
thank you again for the explaination.
Another short question about problems:
I have an active problem, but everything is showing green if I open the problem. Where should I look for the reason, why the problem is active?
Best and thanks,
Jan
Options
- Mark as New
- Subscribe to RSS Feed
- Permalink
06 Dec 2017 04:21 PM
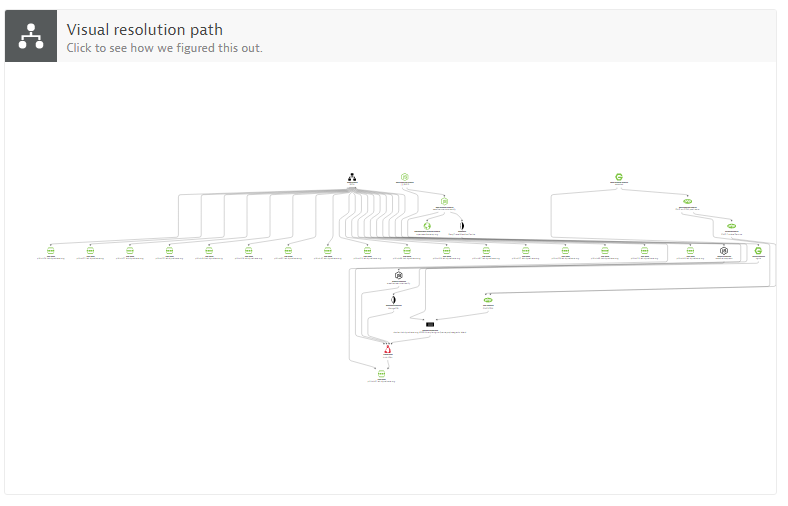
The problem details screen is sometimes misleading because it is showing the summary rather than all details. If there is still a single event open in any of the affected monitored components the problem stays open. You see the number of red components in the title bar and within the visual resolution graph that allows you to see each individual component and event.
