Turn on suggestions
Auto-suggest helps you quickly narrow down your search results by suggesting possible matches as you type.
- Dynatrace Community
- Dynatrace
- Ask
- Open Q&A
- Is there a way to add a high level view that shows committed memory vs. consumed/used memory?
Options
- Subscribe to RSS Feed
- Mark Topic as New
- Mark Topic as Read
- Pin this Topic for Current User
- Printer Friendly Page
Options
- Mark as New
- Subscribe to RSS Feed
- Permalink
31 Jan 2018 04:22 PM
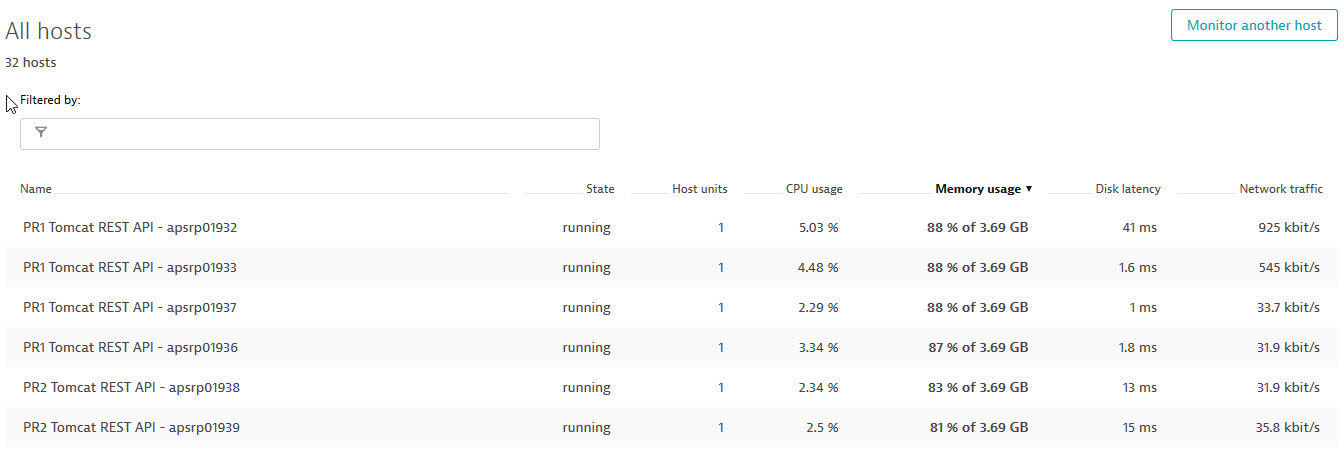
We are looking for a way, without having to drill into each host/device to easily view consumed vs. committed memory. In the example I show below the JVM receives a memory commitment but due to standard operating etc. the consumed memory will fluctuate. It's time consuming to jump into each host to see/alert if consumed isn't fluctuating like it should. We had thought adding a view at the high level to see the existing measure - memory % vs. the consumed would be helpful. Anyone else?
Solved! Go to Solution.
Labels:
- Labels:
-
dynatrace saas
jvm-metrics.jpg
36 KB
3 REPLIES 3
Options
- Mark as New
- Subscribe to RSS Feed
- Permalink
31 Jan 2018 06:39 PM
Hi Alicia,
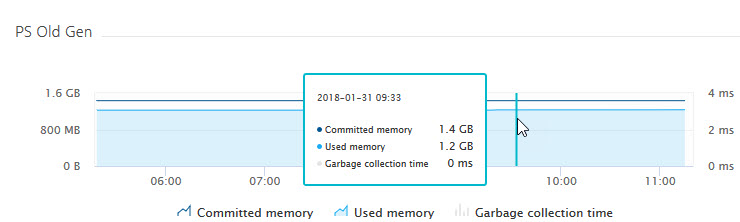
You will need to create a custom chart and select the metrics "Process - JVM Memory (Commited)" and "Process - JVM Memory (Used)" and Build the chart. Select the series you want to filter by if you only want to see these metrics for specific processes. When you do this, you can "Pin to your Dashboard" at the top right of your screen (See screenshot below). Please let me know if this works for you.

Thanks
NJ
Reply
Options
- Mark as New
- Subscribe to RSS Feed
- Permalink
05 Feb 2018 09:17 PM
thanks! So we did this and this is great high level view but notice in the table below you can get reading for max/min/average. Any ideas if you can customize one of the metrics to be current reading?
Options
- Mark as New
- Subscribe to RSS Feed
- Permalink
05 Feb 2018 09:45 PM
The aggregation applies to the chart mainly and also to the value below. There is no "Current" or "Last" aggregation. My only other sugestions are to hover on the chart for the last collected value or to use the API to fetch the metrics. See link below
https://www.dynatrace.com/support/help/dynatrace-api/timeseries/how-do-i-fetch-the-metrics-of-monitored-entities/
Hope This Helps
NJ
Reply
