Turn on suggestions
Auto-suggest helps you quickly narrow down your search results by suggesting possible matches as you type.
- Dynatrace Community
- Dynatrace
- Ask
- Dashboarding
- I have a Request Attribute working for WebLogic HoggingThreadCount, but how do I chart the results
Options
- Subscribe to RSS Feed
- Mark Topic as New
- Mark Topic as Read
- Pin this Topic for Current User
- Printer Friendly Page
Options
- Mark as New
- Subscribe to RSS Feed
- Permalink
17 Aug 2018 02:46 PM
We track the WebLogic Hogging Thread Count in AppMon using a Business Transaction and we alert when the count for a server exceeds 15. I have tried several ways in Dynatrace to replicate this monitor and had a Request Attribute that is working. I can go into a Service and do Custom Analysis and view the count per server. But what I need is to be able to chart these in a dashboard, for multiple servers, grouped by application. When I try to add the Request Attribute to a chart, I've tried several, there is no option available to show the counts in any chart type. When I was on the Custom Analysis chart page I tried the option under ... to Save as a new Dashboard Tile, but I can not find that new Dashboard tile. Please let me know how I can display this Request Attribute in a Dashbioard chart which shows the count and not either a response time or a Request count.
Solved! Go to Solution.
Labels:
- Labels:
-
dashboards classic
-
request attributes
1 REPLY 1
Options
- Mark as New
- Subscribe to RSS Feed
- Permalink
15 Jul 2020 03:53 PM
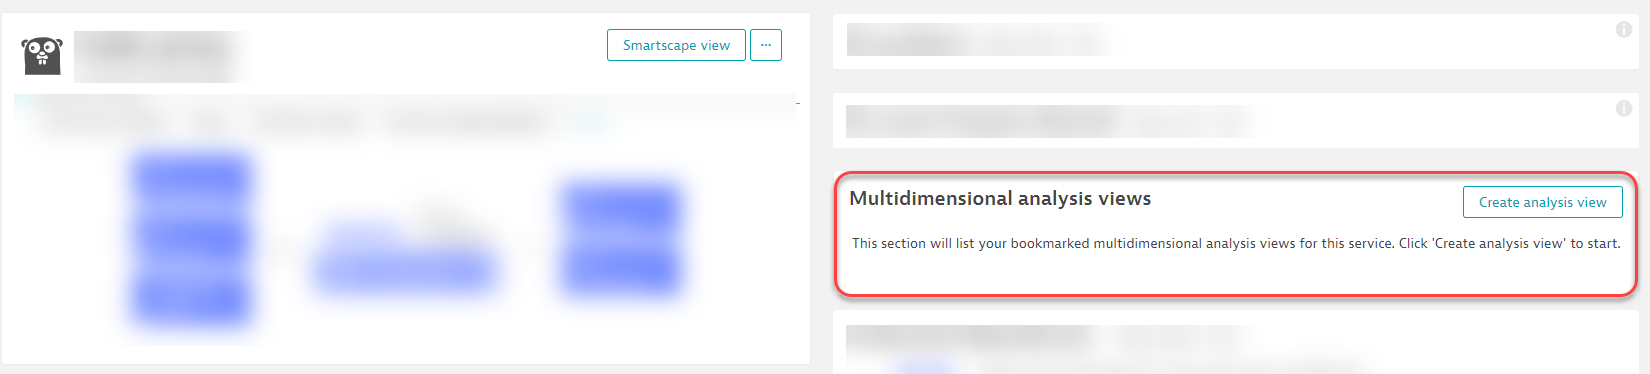
This can be done Via the Multidimensional Analysis view - however, I dont think you can have it saved on a dashboard. Rather it will either reside on the service page or under diagnostic tools.

-Chad
