• Forums
    • Public Forums
      • Community Connect
      • Dynatrace
        • Dynatrace Open Q&A
      • Application Monitoring & UEM
        • AppMon & UEM Open Q&A
      • Network Application Monitoring
        • NAM Open Q&A
        • Enterprise Synthetic Monitoring
      • Synthetic Classic
        • Synthetic Classic Open Q&A
      • BSM Open Q&A
  • Home /
  • Public Forums /
  • Dynatrace /
  • Dynatrace Open Q&A /
avatar image
Question by Rajesh C. · Feb 05 at 11:29 AM · java

Dynatrace Individual JVM alerting

Hi,

I am facing to configure each JVM alerting using Process detection rule.. Please, can someone provide assistance which would be a good way to proceed? when you have 100's of Application servers nearly 300 to 400 JVM's in my tenant - will it be feasible to use Process detection rule.. is night mire for me.

if you look at the AppDynamics and other APM product - they sit top on this feature.. I am facing with new Dynatrace tool

Please advise.

Comment

People who like this

0 Show 0
10 |2000 characters needed characters left characters exceeded
▼
  • Viewable by all users
  • Viewable by moderators
  • Viewable by moderators and the original poster
  • Advanced visibility
Viewable by all users

4 Replies

· Add your reply
  • Sort: 
  • Most voted
  • Newest
  • Oldest
avatar image

Answer by Dave M. · Feb 05 at 06:10 PM

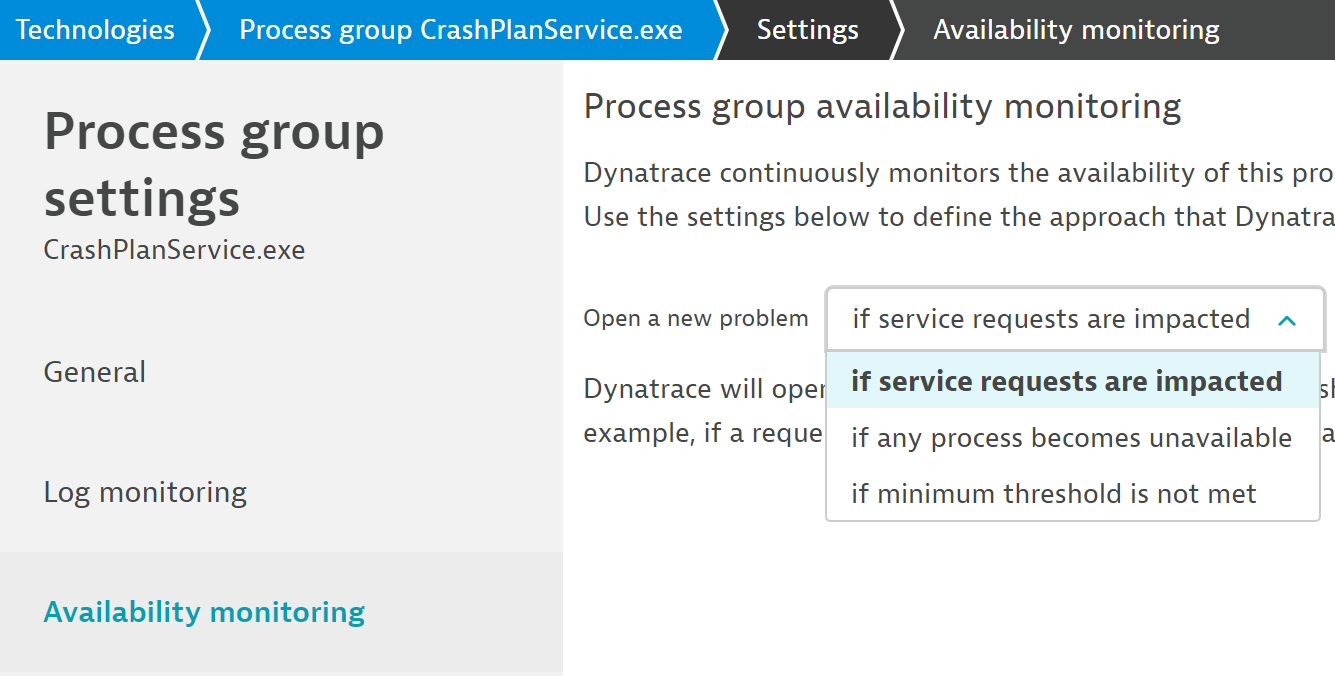
The default setting is to only alert when the process goes down "if service requests are impacted". You have to edit the "Process group settings / Availability monitoring" to change this behavior. Your choices are to alert "if any process becomes unavailable" or if the number of instances is less than a minimum threshold ("if minimum threshold is not met").


pgs.png (110.5 kB)
Comment
sebastian k.

People who like this

1 Show 0 · Share
10 |2000 characters needed characters left characters exceeded
▼
  • Viewable by all users
  • Viewable by moderators
  • Viewable by moderators and the original poster
  • Advanced visibility
Viewable by all users
avatar image

Answer by sebastian k. · Feb 05 at 11:46 AM

Hello, I don't understand actual problem. Dynatrace has detected some process groups. As I understand some of them are note detected as you wish. For example you have one process group called tomcat that containes multiple tomcat processes with different role etc. Yes? If you want split them it is quite easy way. If you have for example environment variable you can create process detection rule that will provide you new name for each new group.

https://www.dynatrace.com/support/help/monitor/pro...

Then you can tweak naming in process group naming rules and all should be fine.

https://www.dynatrace.com/support/help/monitor/pro...

But anomaly detection are not configured fo processes, just for services, hosts and applications so I have problems with understanding your issue :) Be more specific, I'll try to help

Dynatrace aproach at starts it's hard to understand when you are moving from appdynamics or appmon, but after digging into this it's much better and more flexible. I hope you will see it the same way in near future :)

Sebastian

Comment

People who like this

0 Show 0 · Share
10 |2000 characters needed characters left characters exceeded
▼
  • Viewable by all users
  • Viewable by moderators
  • Viewable by moderators and the original poster
  • Advanced visibility
Viewable by all users
avatar image

Answer by Rajesh C. · Feb 05 at 02:24 PM

Thanks, Sebastian for details information, I am looking at On one of Linux server I have 2 Websphere nodes and one of a node has 6 JVM's and I need to alert as proactively if any one of JVM goes down. if you provide some more insight will appreciate if there are so many servers and a huge number of JVM's across different servers how to address? - Thnak - Rajesh Chavan

Comment

People who like this

0 Show 1 · Share
10 |2000 characters needed characters left characters exceeded
▼
  • Viewable by all users
  • Viewable by moderators
  • Viewable by moderators and the original poster
  • Advanced visibility
Viewable by all users
avatar image sebastian k. · Feb 05 at 02:43 PM 0
Share

Dynatrace should automatically inform you about such behavior without any extra instrumentation or configuration.

https://www.dynatrace.com/news/blog/availability-monitoring-alerting-process-group/

Check this out.

Sebastian

avatar image

Answer by Rajesh C. · Feb 05 at 05:43 PM

There was JVM down we did not get the alert. support says that use the Process detection rule for such cases still am in clue less searching for answeres..

Comment

People who like this

0 Show 1 · Share
10 |2000 characters needed characters left characters exceeded
▼
  • Viewable by all users
  • Viewable by moderators
  • Viewable by moderators and the original poster
  • Advanced visibility
Viewable by all users
avatar image Joseph H. · Feb 05 at 05:54 PM 0
Share

Was your JVM shutdown cleanly by a command, or did it die unexpectedly?

Your answer

Hint: You can notify a user about this post by typing @username

Up to 10 attachments (including images) can be used with a maximum of 52.4 MB each and 262.1 MB total.

Welcome to the
Dynatrace Community Forums

Check out the Forum User Guide and Forum Guidelines to learn how to get started.

Community Member of the Month
February 2019

Announcing Dynatrace's Community Member of the Month for February 2019, Larry R.! Click here to read more!

Employee Member of the Month
February 2019

Announcing Dynatrace's Employee Member of the Month for February 2019, Dave M.! Click here to read more!

Live webinar: AIOps done right through enhanced Dynatrace AI root cause detection

Learn the enhanced capabilities of the next generation Dynatrace AI root cause analysis and how to feed it with your own data sources.
Wednesday, February 20, 2019
Register today!

Live webinar: AIOps done right through enhanced Dynatrace AI root cause detection

Learn the enhanced capabilities of the next generation Dynatrace AI root cause analysis and how to feed it with your own data sources.
Wednesday, February 20, 2019
Register today!

NAM 2019 Beta is available

Would you like to have an early taste of what we have cooked up for 2019? We would love to hear your feedback and improve some of the new features. Check NAM 2019 Beta release notes.
Sign up today!

Follow this Question

Answers Answers and Comments

39 People are following this question.

avatar image avatar image avatar image avatar image avatar image avatar image avatar image avatar image avatar image avatar image avatar image avatar image avatar image avatar image avatar image avatar image avatar image avatar image avatar image avatar image avatar image avatar image avatar image avatar image avatar image avatar image avatar image avatar image avatar image avatar image avatar image avatar image avatar image avatar image avatar image avatar image avatar image avatar image avatar image

Related Questions

what does the socketWrite0 measure ? 0 Answers

Monitoring TIBCO BW 2 Answers

easyTravel runEasyTravelNoGUI.sh - keep it running endless 2 Answers

Using Log Analytics for non-File based Logging 1 Answer

Hi, I'm new to dynatrace, how can i install and get the metrics. 2 Answers

Forum Tags

java user management dotnet redis docker ios davis log analytics gui mobileapp database cloud foundry usability services faq management zones user sessions test automation Dynatrace Managed amazon web services plugins php android javascript processes monitoring nodejs sso rest api appmon license dynatrace saas mobile monitoring user tagging installation nam aix oneagent sdk purepath network synthetic monitors apache hosts iis user actions paas azure http monitor linux mongodb mysql dashboard tipstricks rest openshift mission control activegate webserver servicenow kubernetes rum host monitoring cmc key user actions notifications openstack technologies configuration account continuous delivery tagging postgresql security smartscape high five award agent documentation alerting auto-detection cassandra administration vmware oneagent
  • Forums
  • Public Forums
    • Community Connect
    • Dynatrace
      • Dynatrace Open Q&A
    • Application Monitoring & UEM
      • AppMon & UEM Open Q&A
    • Network Application Monitoring
      • NAM Open Q&A
      • Enterprise Synthetic Monitoring
    • Synthetic Classic
      • Synthetic Classic Open Q&A
    • BSM Open Q&A