Turn on suggestions
Auto-suggest helps you quickly narrow down your search results by suggesting possible matches as you type.
- Dynatrace Community
- Dynatrace
- Ask
- Open Q&A
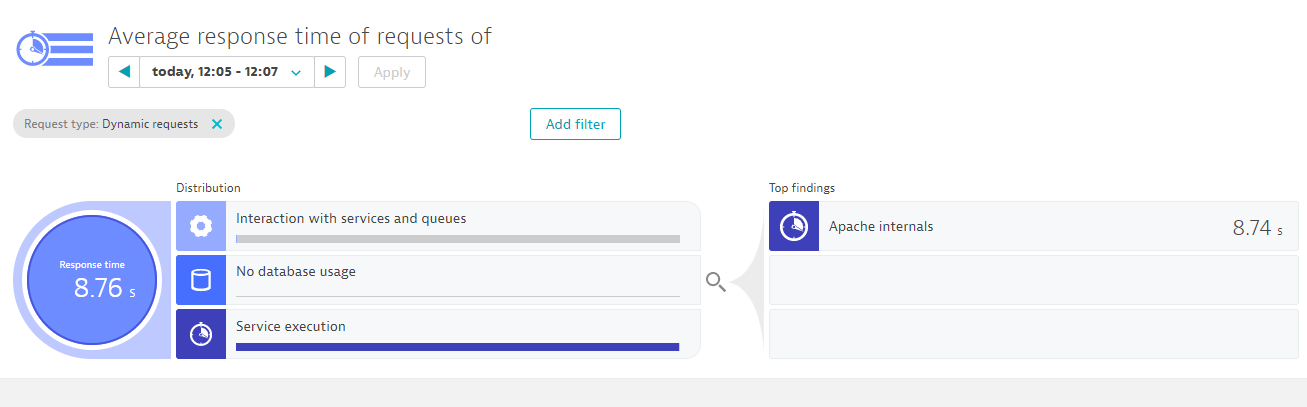
- Response Time Hotspot shows Apache Internals as top findings
Options
- Subscribe to RSS Feed
- Mark Topic as New
- Mark Topic as Read
- Pin this Topic for Current User
- Printer Friendly Page
Response Time Hotspot shows Apache Internals as top findings
Options
- Mark as New
- Subscribe to RSS Feed
- Permalink
01 Mar 2019
06:48 AM
- last edited on
13 Dec 2021
11:53 AM
by
![]() MaciejNeumann
MaciejNeumann
Hi All,
Dynatrace response time hotspot shows Apache internals as top findings. How to analyse the same as no further details available?
Regards,
Mohit
Mohit
Labels:
- Labels:
-
apache
-
distributed traces
6 REPLIES 6
Options
- Mark as New
- Subscribe to RSS Feed
- Permalink
01 Mar 2019 07:41 AM
As that is the service execution time, maybe you select a purePath to see what exactly is happening and where exactly is service execution taking time.
Options
- Mark as New
- Subscribe to RSS Feed
- Permalink
01 Mar 2019 08:09 AM
Hi Akshay,
I have checked the same and it shows all the time was spent at web request apache shown below

Regards,
Mohit
Mohit
Options
- Mark as New
- Subscribe to RSS Feed
- Permalink
04 Mar 2019 01:04 AM
Mohit, is this complete purepath.
I suspect, there is more information if you go down in purePath to see where exactly this time is been spend.
The 1.38min you see if at Apache side, its breakdown is there below if you scroll. Let me know if you get required information.
Options
- Mark as New
- Subscribe to RSS Feed
- Permalink
04 Mar 2019 07:21 AM
Actually it is complete PurePath. The question is if Apache configuration is done properly (not in Dynatrace, in General). There are multiple parameters that can be reasons of performance problems. Is it often to see such transactions freezed on apache?
Sebastian
Regards, Sebastian
Options
- Mark as New
- Subscribe to RSS Feed
- Permalink
08 Mar 2019 03:16 AM
Can you hover on the apache web, and see why exactly is it taking that high self time.
Is it CPU/network/IO etc
Options
- Mark as New
- Subscribe to RSS Feed
- Permalink
08 Mar 2019 07:57 AM
Hi Akshay,
Yes, this is the complete purepath after synchronous invocation the request goes to JBoss server and there is no issue in JBoss server.
Also below is the snapshot as requested.

Hi Sebastian,
The team has checked the configuration and unable to identify the issue as the issue occures intermittently. We are suspecting the issue from Network or OS level configuration.
Regards,
Mohit
Mohit
