Turn on suggestions
Auto-suggest helps you quickly narrow down your search results by suggesting possible matches as you type.
- Dynatrace Community
- Dynatrace
- Ask
- Dashboarding
- Client Side Report with total samples
Options
- Subscribe to RSS Feed
- Mark Topic as New
- Mark Topic as Read
- Pin this Topic for Current User
- Printer Friendly Page
Client Side Report with total samples
Options
- Mark as New
- Subscribe to RSS Feed
- Permalink
03 May 2019 02:32 PM
Hi All,
We are doing a load test with Jmeter tool and monitoring the requests in Dynatrace with the help of "Http Header Manager" (Request Attribute). Now I am looking for a similar report like attached image, can one please provide the suggestions or alternative way.
Thanks, Mahesh
Labels:
- Labels:
-
dashboards classic
2 REPLIES 2
Options
- Mark as New
- Subscribe to RSS Feed
- Permalink
06 May 2019 07:48 AM
You have to go to services that are receiving requests from jMeter (it may be apache, nginx or whatever you've got on frontend side). In this services you can create multidimensional analysis. There you have option to extract data from request attributes and correlate them with requests and other metrics (failure rate, response times etc).
When you will adding metrics to chart, first pick request attribute of your choice. Then click on those metric and you will see options to pick dimensions you want to see on chart. Play with this 🙂

We have also solution that is able to send live metrics from jMeter to Dynatrace. This gives you ability to compare results from DT and jMeter live. It's very useful when you are using multiple scripts in the same time.
Sebastian
Regards, Sebastian
Options
- Mark as New
- Subscribe to RSS Feed
- Permalink
06 May 2019 11:45 AM
Hi Sebastian,
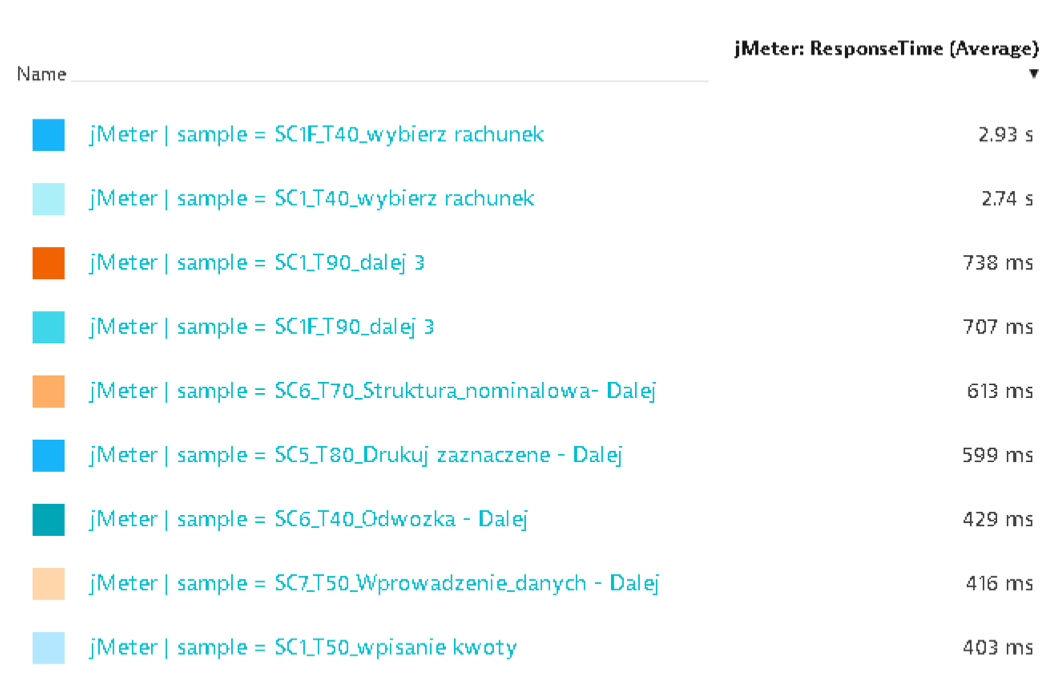
Thanks for your response, I have tried the way you explained but it's not fulfilled my requirement. I am able to capture the graph only for 1 metric at time (attaching the screenshot). Can you please explain second option "send live metrics from jMeter to Dynatrace" & how to export these values to csv or pdf.
Mahesh.
dimensional-report.png
60 KB
