Turn on suggestions
Auto-suggest helps you quickly narrow down your search results by suggesting possible matches as you type.
- Dynatrace Community
- Dynatrace
- Ask
- Real User Monitoring
- No application information are discovered
Options
- Subscribe to RSS Feed
- Mark Topic as New
- Mark Topic as Read
- Pin this Topic for Current User
- Printer Friendly Page
Options
- Mark as New
- Subscribe to RSS Feed
- Permalink
14 May 2019
03:35 AM
- last edited on
23 Mar 2023
01:11 PM
by
![]() MaciejNeumann
MaciejNeumann
DynaTrace Managed is installed in my site. I defined an Environment. The OneAgent is also deployed into the monitoring hosts. The hosts and processes can be discovered gracefully. Since the hosts are servicing our production WebLogic applications (include the front end Oracle HTTP Server), there are many traffic captured by DynaTrace already. However, I couldn't see any application being discovered under "Applications" page. In DynaTrace knowledge, I found this page
Define applications for Real User Monitoring
From the page, it said "My web application", but I cannot find "My web application" also. What's wrong?
Solved! Go to Solution.
Labels:
Reply
7 REPLIES 7
Options
- Mark as New
- Subscribe to RSS Feed
- Permalink
14 May 2019 07:26 AM
First, check if all monitored processes have been restarted. (There is a yellow exclamation mark next to them in Dynatrace UI). Specifically, those which serve the web pages.
The applications don't get discovered, you have to define them. If you don't define them, all the requests will popup at the "My web application".
If you don't see the "My web application" in the Applications menu, it is typically because either the injection of Dynatrace JavaScript failed or the beacon is not accessible. If you are on default settings, first check if the Javascript with name containing ruxitagent is present in the web pages (see page source). If JavaScript is not present, there can be many reasons for that. In my experience either the page is not valid or the servlet already produces gzipped output so Oneagent cannot inject.
If the JavaScript is there, then maybe it cannot send data to the beacon URL (it's in the JavaScript tag). This typically happens if there are some load balancers doing URL patch remapping in the chain.
Certified Dynatrace Master | Alanata a.s., Slovakia, Dynatrace Master Partner
Reply
Options
- Mark as New
- Subscribe to RSS Feed
- Permalink
14 May 2019 08:20 AM
Thanks for your answer.
All WebLogic servers and the Oracle HTTP Server (OHS) "httpd" processes are restarted. No "Yellow" mark on the "Deployment Status" page.
We just installed the DynaTrace Managed servers, created "Environment" and deployed OneAgent, no other configuration change(s) is applied.
I tried to put a very simple static HTML to the OHS htdocs, no JavaScript is injected (ruxitagent is not present). I also checked the response of the simple static HTML page, the response is not gzipped.
In DynaTrace documentation, it mentioned that the JavaScript is injected from Apache (i.e. OHS in my site), is there configuration is necessary on it?
Reply
Options
- Mark as New
- Subscribe to RSS Feed
- Permalink
14 May 2019 08:33 AM
Hello Thomas L.
If you don't see any of your applications or Real User Monitoring data in Dynatrace, the first thing you need to do is confirm that there is traffic in your web front-end processes (web server, Java, Node.js, etc). To do this, interact with one of your applications' pages to generate some traffic.
You can follow the link for more understanding.
Did you install a Full Stack Agent or a Standalone Agent?
Regards,
Babar
Reply
Options
- Mark as New
- Subscribe to RSS Feed
- Permalink
14 May 2019 09:13 AM
Hi Babar,
Yes, I confirm that there are traffic in my web front-end. There are many services and purepath were captured in "Transactions & Services".
For the Agent type, what is Full Stack Agent or Standalone Agent? How can I know the type of my installed Agent? I followed the deployment steps on DynaTrace Managed Web UI to run the deploy commands to deploy the OneAgent.
Regards,
Thomas
Reply
Options
- Mark as New
- Subscribe to RSS Feed
- Permalink
14 May 2019 12:47 PM
Hello @Thomas L.
I meant Solaris agent is not a Full Stack Agent, therefore, you will have to configure the application to start monitoring.
On Solaris, Dynatrace only supports Java and Apache HTTP Server applications and as such you need to decide which applications to monitor.
Regards,
Babar
Options
- Mark as New
- Subscribe to RSS Feed
- Permalink
14 May 2019 09:34 AM
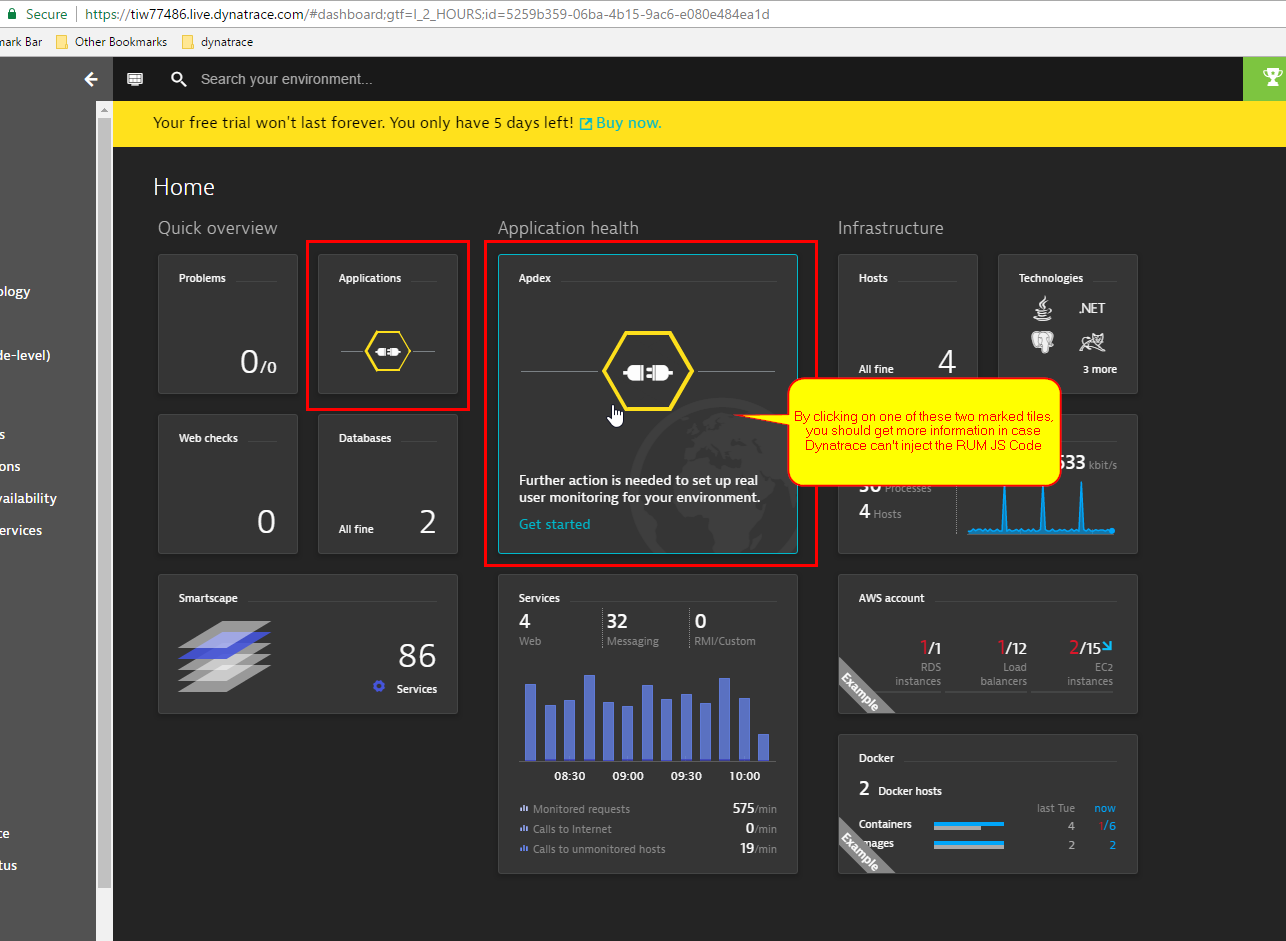
The "My web application" will appear if Dynatrace has captured the first user action. If Dynatrace detects services which deliver html and you have DEM Units for Real User Monitoring but the OneAgent can't inject the real user monitoring JS code or the beacon is not delivered back to the Dynatrace infrastructure you should see the "First success health information" in the application list or via the application tiles on your dashboard:
I would recommend to open a support ticket. The support team will take a look at your environment and will help you to identify the issue.
Reply
Options
- Mark as New
- Subscribe to RSS Feed
- Permalink
14 May 2019 10:47 AM
Hi Alexander,
OK, I raise a Support Ticket.
Thanks.
Thomas
