Turn on suggestions
Auto-suggest helps you quickly narrow down your search results by suggesting possible matches as you type.
- Dynatrace Community
- Dynatrace
- Extend
- Extensions
- Let's be clear when it comes to messaging queues & Dynatrace
Options
- Subscribe to RSS Feed
- Mark Topic as New
- Mark Topic as Read
- Pin this Topic for Current User
- Printer Friendly Page
Let's be clear when it comes to messaging queues & Dynatrace
Options
- Mark as New
- Subscribe to RSS Feed
- Permalink
25 Jun 2019
12:31 PM
- last edited on
28 Jun 2021
11:55 AM
by
![]() MaciejNeumann
MaciejNeumann
UPDATE 10/23/20
Since this posting, Dynatrace has created a Tibco EMS plugin which does in fact now allow you to monitor the metrics around queues. This is an outstanding step forward!
There is a limitation in terms of assigning ownership and targeted notifications if you are structured as a multi team environment.
The details of that can be found here:
The great news is that Dynatrace has acknowledge it and is working towards enhancements to address this limitation. This is one of the many things I love About Dynatrace - They listen to their customers and keep us all moving forward.
Just to be clear on the below article, Dynatrace does a great job at tracing requests, however has a very long way to go when it comes to providing what is needed in terms of queue depths and setting thresholds around them.
Breaking down barriers: IBM MQ tracing across queue managers and queue clusters
Michael KoppProduct news · June 24, 2019
Dynatrace already offers rich support for tracing your business requests end to end, including all major queue vendors from ActiveMQ, HornetQ, RabbitMQ, Tibco EMS, Software AG’s webMethods Broker and Universal messaging, Azure Service Bus, and IBM MQ.
We have struggled with trying to monitoring queue depths within Tibco EMS using Dynatrace and to date it has been a failure. We went down the road of custom plugin development and that is when it became very known to us that Dynatrace does not deal well with trying to tackle queue depth monitoring which frankly is vital in terms of monitoring messaging which is why it leaves me scratching my head.
It's not to say that monitoring queue depths of Tibco EMS would be impossible with Dynatrace, but there is nothing that would be user friendly and straightforward about it at this time.
We are now considering using GCP Pub/Sub as well and not sure that Dynatrace can be used. Keep in mind, this is not because we do not wish to use Dynatrace for it - We would LOVE too!
So this brings me to 3 questions for Dynatrace:
#1 Are there any plans to allow for the monitoring of messaging queue depths with the ability to adjust thresholds and be out of the box? If so, for which technologies and what does that timeline look like?
#2 When is GCP going to become just as supported as AWS and Azure and reflect that within the Dynatrace GUI?
#3 This is somewhat related to question #1, but what does the roadmap look like to support GCP Pub/Sub? Again, this is not about "requests end to end" and about the ability to monitor and alert on queue depths.
@Michael K. - perhaps you could shed some light around these things? Thank you!
Labels:
- Labels:
-
extensions
-
queues
-
technologies
Reply
5 REPLIES 5
Options
- Mark as New
- Subscribe to RSS Feed
- Permalink
25 Jun 2019 07:51 PM
What you’ve posted is really interesting topic. I will consider it as well in our company as candidate for next plugin to Dynatrace. I have some idea how we can make it work but I have to check it 🙂 But I’m curious as well if DT has any plans for it 🙂
Sebastian
Regards, Sebastian
Reply
Options
- Mark as New
- Subscribe to RSS Feed
- Permalink
03 Dec 2019 03:25 PM
Hi there, I'm in the same situation. We use Dynatrace to monitor our platform on GCP with full stack agents but we really need a Pub/Sub view of any sort and so far nothing seems to be available.
DT is doing great on AWS and Azure but what about GCP for cloud provided services ?
Reply
Options
- Mark as New
- Subscribe to RSS Feed
- Permalink
03 Dec 2019 04:19 PM
Funny you should mention that. We too are in GCP and moving more everyday and have the exact same need. I think when it comes to GCP in general, Dynatrace needs to start releasing more news about their plans.
You are correct, there is a strong focus and support on AWS and Azure, but very little information seems to come in the way of GCP. I am not sure if this is just due to business relationships between vendors or what the reasoning is behind it.
They do support GCP as we are using them now, but what enhancements are coming around it are far and few in between.
One thing that really bugs me is that you clearly see AWS and Azure right there in the menu on Dynatrace, yet GCP continues to be missing. Yes you have Kubernetes, etc. but, GCP is oddly missing from the collection.
I would like to see some updates and focus from Dynatrace around GCP and a roadmap of what is coming.
Reply
Options
- Mark as New
- Subscribe to RSS Feed
- Permalink
04 Dec 2019 03:59 AM
Hey Larry , We are yet to compare notes about the EMS and BW plugins, I have extended my EMS plugin to include the following Metrics:
Queue Depth |
Pending Messages |
outbound Message Rate |
Inbound Message Rate |
Consumers |
I have created a dashboard with custom charts for this, but I am not too happy about the way it is aggregated on the dashboard over a selected time period, so these metrics cannot be seen as real time from the dashboard. It is real time in the process information though.
I am also puzzled about the default process Detection/naming rules for EMS , it depends obviously on the process EXE , I have multiple EMS servers and they are all detected into different process group instances(process startup in different paths per host) ALL named "Tibco EMS". Do you perhaps have any ideas to change the group naming so that it reflects an environment etc ?
@Sebastian K., I am happy to donate the work I have done on the BW ActiveGate and EMS oneagent plugin to the cause.
=
Reply
Options
- Mark as New
- Subscribe to RSS Feed
- Permalink
04 Dec 2019 02:20 PM
Good morning! Yeah I have been side lined working on more end of the year stuff. I was trying to remember, are you building a OneAgent plugin or ActiveGate plugin?
Asking because when I tried to go the OneAgent route, I found no method to get get to a level of where each queue name could be tagged. This is a requirement for us as that is how we assign ownership. By going the route of the ActiveGate plugin, that allows me to create custom devices so I take each queue and do exactly that, I turn each one into a custom device. This then treats each one independently and allows for auto-tagging. I also placed them under their own technology called "EMS Queues" so that they are separated from the core "Tibco EMS" technology. The reason for this is because there is one team which owns the support of Tibco EMS itself for things such as upgrades, patching, etc. and then the queues are owned by multiple teams.
We are bringing in....
- Queue Depth
- Queue Size
The reason for this is due to the amount of custom metrics which each metric consumes. Because we go to a depth of the individual queues, so it adds up fast depending on how many queues you have.
I too am still playing around with the aggregate. I will be honest, this is one area of Dynatrace that always seems to confuse me that I can never keep straight in my head and often just have to play with it. SUM, COUNT, MAX, etc... I always have to go back and look up exactly what each one means.
There are pros and cons to each method.
OneAgent Plugin
Pros
- AI is utilized.
- The relation ship between the said queues, services, processes, etc. are understood by Dynatrace.
- Does not use as many custom metrics as the ActiveGate version due to higher up the tree scope.
Cons
- All queues are placed under the technology "Tibco EMS" process.
- Queues are not treated independently to a point that they can individually be tagged manually or through rules.
- OneAgent plugins do not have the ability to create custom devices.
- Does not scope deep enough down to each independent queue level.
ActiveGate Plugin
Pros
- Has the ability to create custom devices, therefore allowing each queue to be turned into its own individual device.
- Haas the ability to scope down to each individual queue.
- Because queues can be individual devices, you can manual and / or auto-tag like you would anything else.
- Queues can be separated out from under the "Tibco EMS" technology group which is a huge benefit if you have multiple teams supporting different things within EMS.
- Each team can create custom thresholds under "Custom events for alerting" and can be very specific due to the fact that the plugin uses the queue names as a dimension.
Cons
- The AI is not utilized.
- The relationships between said queues, services, processes, etc. are not understood or shown by Dynatrace. This one might not stay a con as I think it's due to the IP being assigned more than once. Working on this one.
- SmartScape shows these custom devices which are queues as hosts.
- Can utilize a large amount of custom metrics.
I am still working on the ActiveGate plugin and I might be able to reach a point where the relationship between the queue and services is shown. I was talking to some folks at Dynatrace and I think it's due to the fact that the same IP is being used which is why it does not track. So currently I am working on the structure a bit to see if I can get around that.
Both options are a trade off from what I have found. It really depends on the need at the end of the day. For us, we must be able to obtain these metrics, but also assign ownership to each queue and therefore custom devices are a must.
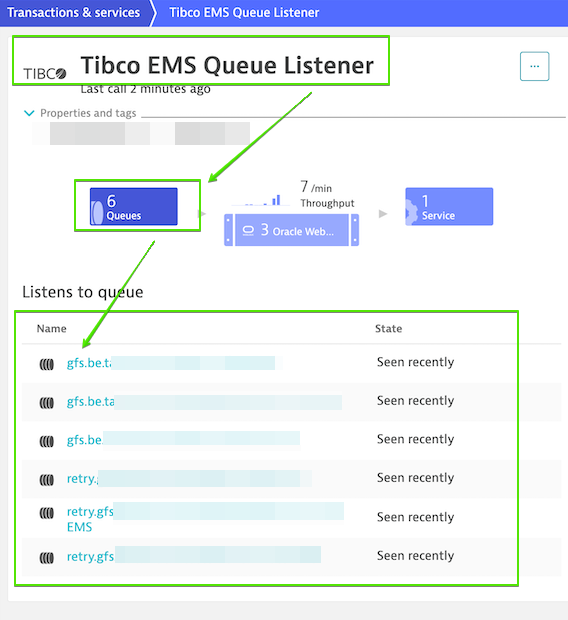
While I can not speak for Dynatrace, I have had a few conversations with these great minds over there about this. The out of the box solution for EMS and any other messaging service for that matter would be for Dynatrace to just go one level deeper. As you can see below, Dynatrace out of the box detects the EMS queue names. It already see's these queues. If you click on them however they just take you to the SmartScape and do not go any deeper. My hope is that Dynatrace will enrich the product more for messaging services so that not only do you see the queues, but can click into them and then see all of the metrics which are vital to customers. Such as queue depth, size, etc. This is a challenge as every messaging service is not the same. For example, when it comes to Tibco EMS, they would need to use the tibemsadmin. For something like Pub/Sub in GCP, they would most likely need to tap into StackDriver. There is a big challenge there, but I think it's one they need to meet due to the fact that if you can not get down to these levels of metrics when it comes to messaging services, it becomes somewhat useless. I do think we will see headway on this from Dynatrace eventually, but for which messaging services and when - Anyones guess.
In terms of the process group detection, are all the servers running the exact same version of EMS? If so, I would bet that it's the different paths thats making Dynatrace separate them which I would expect. That being said, if you go to "Settings", "Processes and containers", and select "Process group detection", you can build a new "detection rule" there which should then allow you to group them up.
Hope that helps! I will release what I have soon. I need to get over to GitHub.
Thanks!
Reply
