Turn on suggestions
Auto-suggest helps you quickly narrow down your search results by suggesting possible matches as you type.
- Dynatrace Community
- Dynatrace
- Ask
- Open Q&A
- Are there ways to get composite views across your applications in reporting?
Options
- Subscribe to RSS Feed
- Mark Topic as New
- Mark Topic as Read
- Pin this Topic for Current User
- Printer Friendly Page
Are there ways to get composite views across your applications in reporting?
Options
- Mark as New
- Subscribe to RSS Feed
- Permalink
30 Jul 2019 02:02 PM
At our company we have different systems owned by different teams, so our Applications are broken out to represent those teams. These applications cover a couple hundred .Net web applications. Our VP is interested in being able to see metrics across the entire system over time and sometimes would like more than one metric on a chart. He'd also like to be able to look at these types of things sliced in different ways, like how those metrics are looking for a particular regional office.
1. Is there any way to get at user session type data across the whole system using custom charts? Can it aggregate data together?
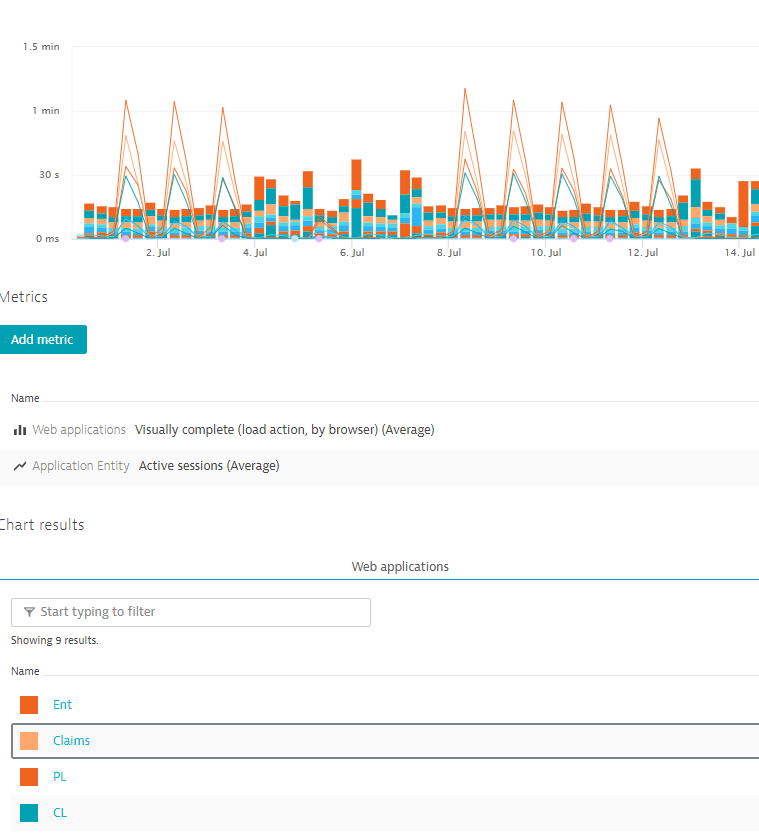
He'd like to be able to see Visually complete (as a bar) along with active sessions (as a line) on the same chart over time. User Session Queries don't allow me to show more than one data point over time so, while I can aggregate the data, I can't present it how he wants. Is there any way to do this across our whole system, not specific to an individual Application? He likes the data on this chart because it represents all applications but it just isn't readable:
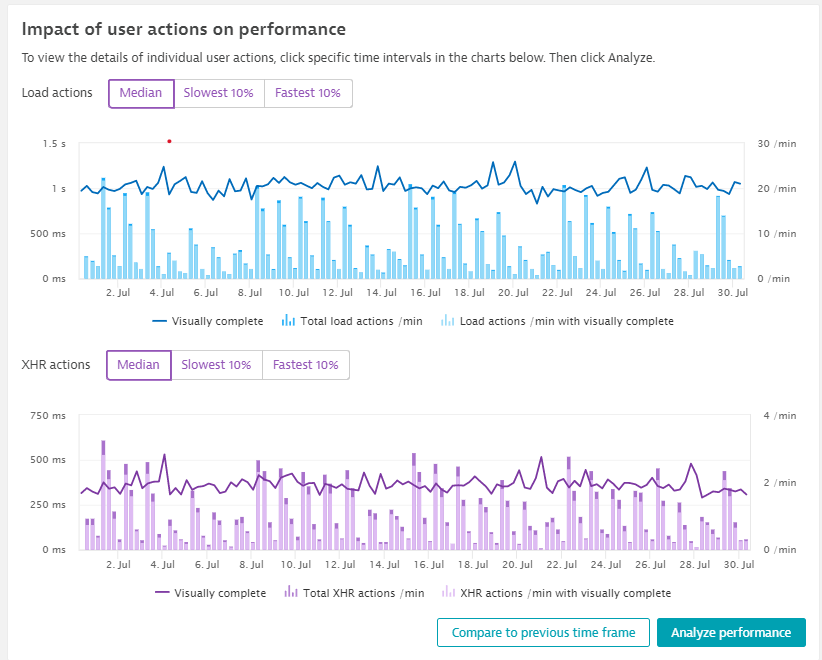
If this can't be done with custom charts, is there any way that I can do something like it with a User Session Query? How are people building reports for overall system health in Dynatrace? What he truly wants is something that looks like the report at the Application level for performance, but shown across the whole system and individually slice-able by Application after that. And then slice-able by regional office (geo-location). I can't find anything that looks like that in the system other than it does some of that at the Application level once you're in the Application:
Labels:
- Labels:
-
reports
1 REPLY 1
Options
- Mark as New
- Subscribe to RSS Feed
- Permalink
30 Jul 2019 06:40 PM
Data from USQL can be presented only on USQL tiles. So if there are no metrics related to user sessions that works for you, then you need to have charts one under another. Combining them is not possible. What you need is USQL tile that accept more than one USQL query at once. You should post an RFE 🙂
Sebastian
Regards, Sebastian
