- Dynatrace Community
- Dynatrace
- Extend
- Extensions
- Datapower Calls Per Second doesnt show data on Count aggregation
- Subscribe to RSS Feed
- Mark Topic as New
- Mark Topic as Read
- Pin this Topic for Current User
- Printer Friendly Page
- Mark as New
- Subscribe to RSS Feed
- Permalink
02 Sep 2019
11:47 AM
- last edited on
28 Mar 2023
07:52 PM
by
![]() Ana_Kuzmenchuk
Ana_Kuzmenchuk
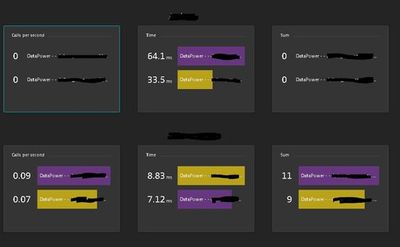
I've created 3 charts for DataPower - one for the "Time" metric, one for "Calls per Second" on Average aggregation and another for "Calls Per Second" on Sum aggregation, as shown on the added picture.
The "Time" metric shows data on a request (or requests) made in the time frame, but both "Calls Per Second Average" and "Calls Per Second Sum" show zero data on the same time frame.
It only happens on some services, not all of them, again, as shown in the added picture.
Is there a way to explain or sort out that situation?
Solved! Go to Solution.
- Labels:
-
extensions
- Mark as New
- Subscribe to RSS Feed
- Permalink
02 Sep 2019 12:17 PM
Hi,
DataPower does not supply decimals when reporting the number of calls. As we poll once every minute there needs to have been at least 60 requests in the previous minute to get something else than 0. Are you sure that is the case for the service?- Mark as New
- Subscribe to RSS Feed
- Permalink
03 Sep 2019 03:29 PM
But as you can see in the picture it did capture 11 and 9 calls for the lower service, much less than 60, how come?
- Mark as New
- Subscribe to RSS Feed
- Permalink
04 Sep 2019 03:45 PM
If there have been 60 transactions per minute the number of requests per second is 1. You've got 11 minutes in your timeframe with an average of 1 request per second (or 4 minutes with 2 requests and 3 minutes with 1 request for example, which sums up to 11).
I'll improve it in the next version to be the number of requests per minute and have Dynatrace store it as such instead of a count.
Thanks for the feedback!
- Mark as New
- Subscribe to RSS Feed
- Permalink
05 Sep 2019 07:33 AM
Thanks a lot for your help!
when will the next version come out and where can we follow it?
- Mark as New
- Subscribe to RSS Feed
- Permalink
05 Sep 2019 08:51 AM
I just released it.
Please open a support ticket with this issue, reference this thread and support will send the new version. We're still working on an automatic distribution method.

