Turn on suggestions
Auto-suggest helps you quickly narrow down your search results by suggesting possible matches as you type.
- Dynatrace Community
- Dynatrace
- Ask
- Dashboarding
- Is there a metric to show the total number of calls and Number of HTTP 5xx errors in the same dashlet?
Options
- Subscribe to RSS Feed
- Mark Topic as New
- Mark Topic as Read
- Pin this Topic for Current User
- Printer Friendly Page
Options
- Mark as New
- Subscribe to RSS Feed
- Permalink
12 Dec 2019
11:05 AM
- last edited on
06 May 2021
04:10 PM
by
![]() MaciejNeumann
MaciejNeumann
I would like to plot a chart to show something like below in the same dashlet in dynatrace managed,
<Total number of calls>/<Number of HTTP 5xx errors>
Is this possible? If so could you please let me know what metric i should use to get this?\
I have tried Failure rate metric but it shows only the percentage of 5xx errors.
Number of HTTP 5xx errors metric shows only the failure count.
I would like to combine both of these.
For example, If there are thirty 5xx errors out of Hundred calls per minute, i would like to display both of these values in same dashlet.. Could someone advise if this is possible in dynatrace managed?
Solved! Go to Solution.
Labels:
- Labels:
-
dashboards classic
-
http monitor
3 REPLIES 3
Options
- Mark as New
- Subscribe to RSS Feed
- Permalink
12 Dec 2019 11:40 AM
Hi Mathivanan,
You could add another metric to your custom chart and plot both of these in the same graph.
So, you would have the 'Number of HTTP 5xx errors' and then click on 'Add Metric' and add something like 'Action Count' to the same graph.
Hope that helps!
Options
- Mark as New
- Subscribe to RSS Feed
- Permalink
12 Dec 2019 04:39 PM
@Mathivanan E., You can most definitely do this via the custom chart tools. I have created an example of this - but I dont have any errors in the system to show you what the graph would look like with failures but the possibilities are endless. You can also then click that service that failed and drill right into it from there. You can customize it any way you'd like and pin it to any dashboard you'd like as well.
Colors can be change, graph styles can be changed....etc... You can also filter the graph down to the data you only want to see.

Reply
Options
- Mark as New
- Subscribe to RSS Feed
- Permalink
12 Dec 2019 07:53 PM
it appears my image didnt attach 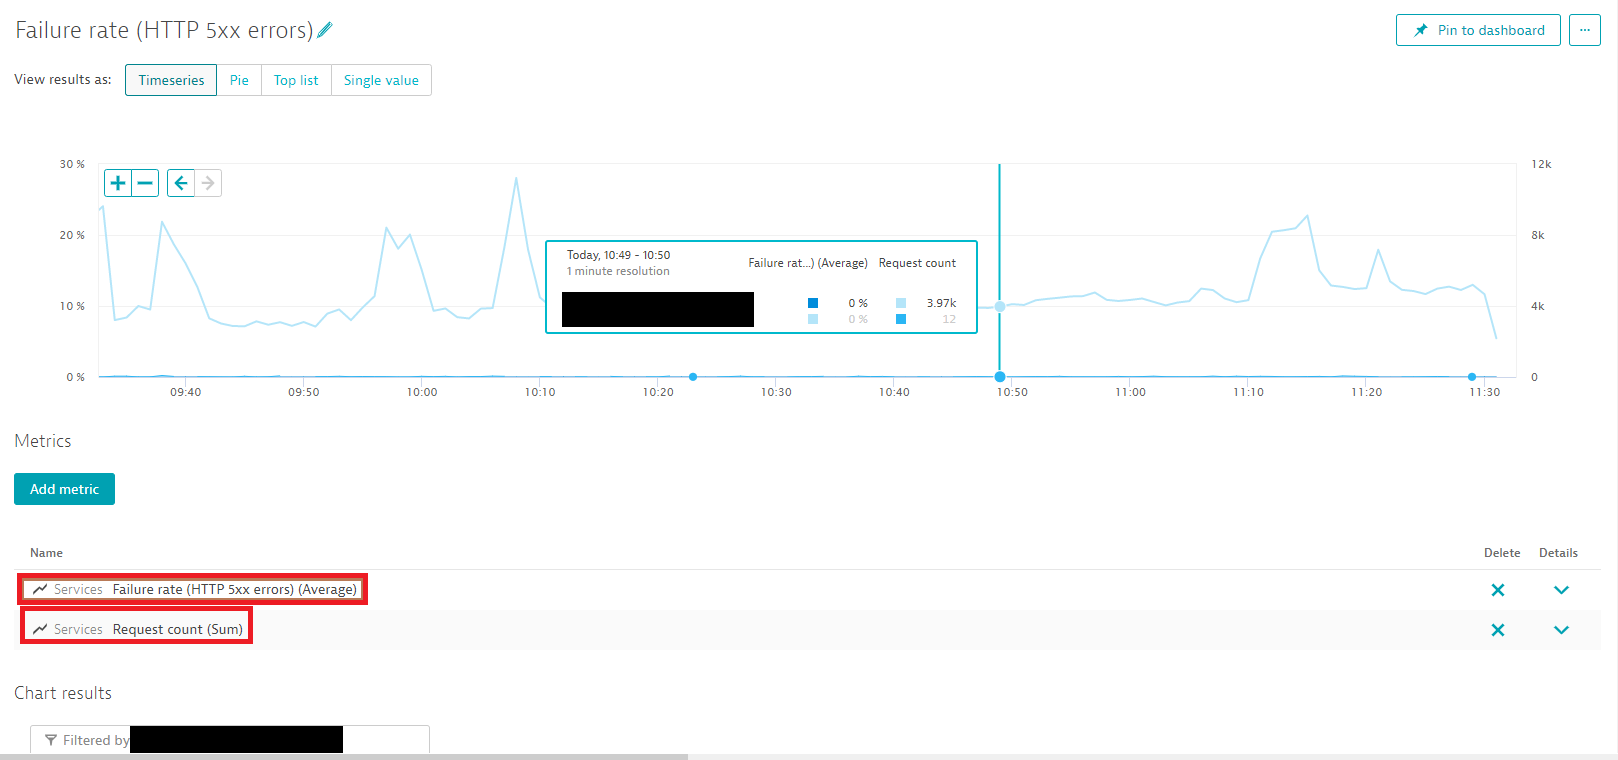
Reply
