Turn on suggestions
Auto-suggest helps you quickly narrow down your search results by suggesting possible matches as you type.
- Dynatrace Community
- Dynatrace
- Extend
- Extensions
- Using regex filter in Dynatrace plugin for Grafana
Options
- Subscribe to RSS Feed
- Mark Topic as New
- Mark Topic as Read
- Pin this Topic for Current User
- Printer Friendly Page
Options
- Mark as New
- Subscribe to RSS Feed
- Permalink
30 Jan 2020 01:39 PM
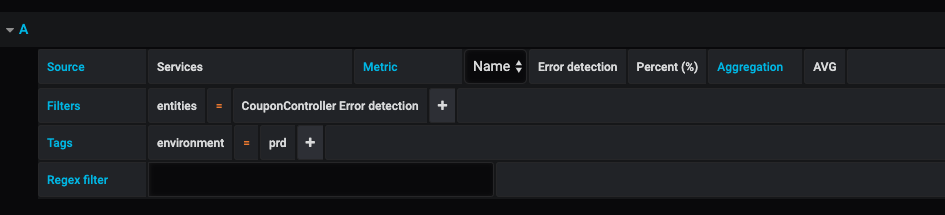
I am using the Dynatrace plugin in Grafana to create charts of failed requests for our controller service. I am able to pull a list of total requests, however, it aggregates all requests into one metric. As far as I've found, there is no way to split by request other than using the regex filter field. I am trying to split the metric by it's two different requests:
RecordType:[^@]*Request:createCoupon[^@]*
RecordType:[^@]*Request:editCoupon[^@]*
Unfortunately this is not working for me and I can't find much documentation about it. Does anyone have experience with the Dynatrace plugin in Grafana? Here's a picture of the default query without the filter being used.
Solved! Go to Solution.
Labels:
1 REPLY 1
Options
- Mark as New
- Subscribe to RSS Feed
- Permalink
05 Feb 2020 05:52 PM
But Services metrics will not return to you information about each request separately. You will have failure rate / response time / throughput for whole service. To See metrics for separated requests, you have to mark them as key request, and use then metrics related to them itself.
Sebastian
Regards, Sebastian
