Turn on suggestions
Auto-suggest helps you quickly narrow down your search results by suggesting possible matches as you type.
- Dynatrace Community
- Dynatrace
- Ask
- Dashboarding
- CPU Usage - Chart - Dashboard
Options
- Subscribe to RSS Feed
- Mark Topic as New
- Mark Topic as Read
- Pin this Topic for Current User
- Printer Friendly Page
CPU Usage - Chart - Dashboard
Options
- Mark as New
- Subscribe to RSS Feed
- Permalink
02 May 2020
06:56 PM
- last edited on
22 Dec 2022
11:04 AM
by
![]() AgataWlodarczyk
AgataWlodarczyk
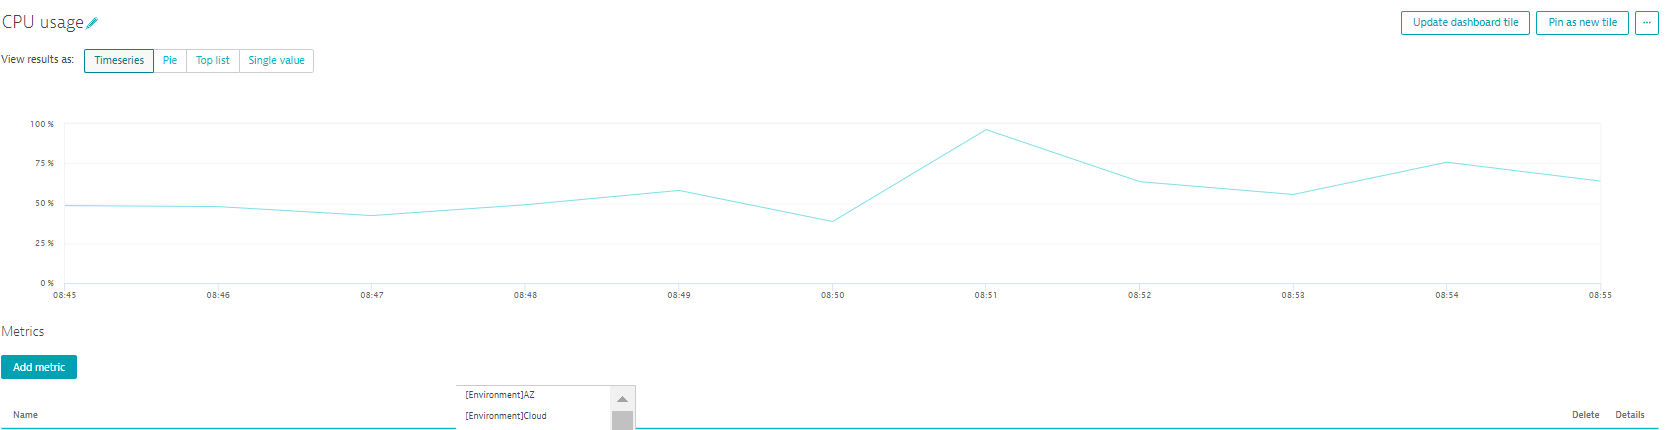
Thi is the Dynatrace dashboard, custom chart page. Trying to create CPU usage chart - Maximum (5 mins window) and it shows 95% CPU utilizaton for some of the hosts.
When I click on the individual host, it is showing way less value

I would like to understand the aggregation method used in the individual host page.
Also, if VM has 4 cores, the CPU percentage provided by Dynatrace is the aggregation of all 4 cores, is it?
Labels:
- Labels:
-
dashboards classic
4 REPLIES 4
Options
- Mark as New
- Subscribe to RSS Feed
- Permalink
02 May 2020 08:21 PM
I tried to replicate your data, but it's good, as it should be. What OS are your hosts running (suppose it's Linux)?
And yes, the CPU percentage considers all the cores in a VM.Could you filter the custom graph to include only the host you are showing below?
Antonio Sousa
Reply
Options
- Mark as New
- Subscribe to RSS Feed
- Permalink
05 May 2020 06:36 AM
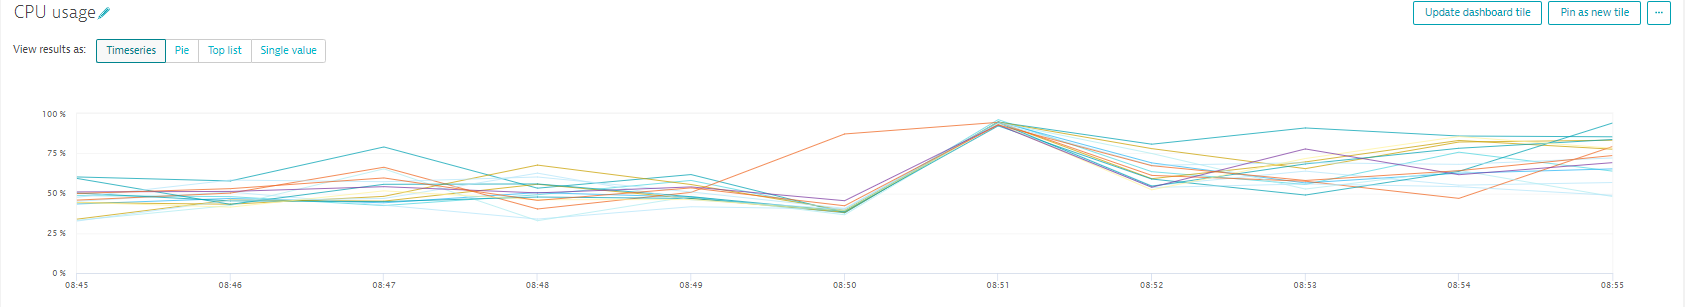
Sharing the custom graph as requested
Options
- Mark as New
- Subscribe to RSS Feed
- Permalink
05 May 2020 08:18 AM
Looks like around 08:47 the CPU value that was seen in the first graph is similar to the custom graph. But the 08:51 value is nowhere near 100% in the first graph as it is in the Custom Graph.
I would suggest opening a support ticket, so someone can look at the values more clearly.
Antonio Sousa
Options
- Mark as New
- Subscribe to RSS Feed
- Permalink
03 May 2020 04:28 AM
So the host page you are showing is Linux. The system adds up all of those metrics to give you the overall usage. This is the percentage of usage for all the cpus allocated for that host (1,2,3,4 and so on)
-Chad
Reply
