Turn on suggestions
Auto-suggest helps you quickly narrow down your search results by suggesting possible matches as you type.
- Dynatrace Community
- Dynatrace
- Ask
- Real User Monitoring
- We're having difficulties to localize some endpoints
Options
- Subscribe to RSS Feed
- Mark Topic as New
- Mark Topic as Read
- Pin this Topic for Current User
- Printer Friendly Page
Options
- Mark as New
- Subscribe to RSS Feed
- Permalink
20 May 2020 04:16 PM
Hi everyone, We're having difficulties trying to localize some endpoints, I mean we know that the endpoints are being consumed because we have New Relic too, and there I can see that there are calls to those endpoints but I can't see them in Dynatrace. I've already tried to find them with the diagnostic tool->top web requests and put the endpoints that I want to see, of course with a huge period of time and doing some filtering, but nothing. What could be a reason that my team and I are not able to see those endpoints? By the way, we are not allowed to use "User sessions module"
Thanks a lot!!
Regards!!
Solved! Go to Solution.
Labels:
- Labels:
-
user actions
-
user sessions
5 REPLIES 5
Options
- Mark as New
- Subscribe to RSS Feed
- Permalink
20 May 2020 04:36 PM
I know nothing about New Relic but the fact that it is in place draws attention. If it injects in a fashion similar to Dynatrace normally only one would be active at any point in time, so the fact that you're able to see it there could be why you can't see it in Dynatrace.
I'd navigate to the process in Dynatrace that you expect would be handling this incoming web request (the one monitored by NR now) and see if there are any messages about instrumentation not being fully enabled, and whether you see any services detected. That or if you can't find the process can all be reasons you wouldn't see the request. I'd start by finding the host and then finding the process from there.
Options
- Mark as New
- Subscribe to RSS Feed
- Permalink
20 May 2020 05:28 PM
The New Relic agent inserts a javaScript snippet to instrument the applications webpages to collect data for browser monitoring. I guess Dynatrace do something similar to get the RUM. But for that reason we installed the Dynatrace Oneagent, with just the infrastructure flag enabled. And we're trying to see which service is consumed when one of those endpoints are being called. By the way, if I filter some web requests throught the "Diagnostic tools -> Top web requests" feature, does it will always brings all the endpoints that are being called with that filter? Or it could happen that misses some web requests...
Thanks again for your prompt answers!!
Options
- Mark as New
- Subscribe to RSS Feed
- Permalink
20 May 2020 05:59 PM
By the 'infrastructure flag' do you mean cloud-infrastructure mode of OneAgent? If so you won't see any web requests, services, or purepaths. You only see OS and process health in that mode.
Options
- Mark as New
- Subscribe to RSS Feed
- Permalink
20 May 2020 06:22 PM
I mean this flag
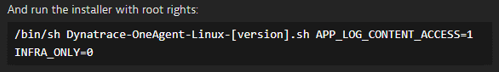
we put this flag "INFRA_ONLY" to true, and we can see services and which web requests are being called, but I don't know why I can only see some web requests, is it a normal behavior?
Is it possible to collect all the web requests that consumes our server services? or does the Dynatrace Oneagent only collect the most called web requests and misses some web requests?
Options
- Mark as New
- Subscribe to RSS Feed
- Permalink
20 May 2020 06:45 PM
If INFRA_ONLY was set to 0 this means you'll potentially see services for those hosts, if it is set to 1 you will not see services for those hosts. Note that that setting can be changed after the fact at the host level.
As it is a host/agent level setting it's possible it's inconsistent across the environment. But in infrastructure mode you will see no requests for the processes running on that host. That's why I'd look at the server that is handling this request you're looking for to ensure that it is running in Fullstack mode (i.e. INFRA_ONLY=0). If it is set to Fullstack mode then you'd check the process itself to ensure there's no warnings about restarts being required or anything.
https://www.dynatrace.com/support/help/shortlink/infrastructure#infrastructure-monitoring-
