Turn on suggestions
Auto-suggest helps you quickly narrow down your search results by suggesting possible matches as you type.
- Dynatrace Community
- Dynatrace
- Ask
- Alerting
- Problem Duration is less than Event duration
Options
- Subscribe to RSS Feed
- Mark Topic as New
- Mark Topic as Read
- Pin this Topic for Current User
- Printer Friendly Page
Options
- Mark as New
- Subscribe to RSS Feed
- Permalink
02 Aug 2020
03:11 PM
- last edited on
17 May 2021
10:15 AM
by
![]() MaciejNeumann
MaciejNeumann
Could you please get me some insights on how the duration time of Problem and Events (which are aggregated under a Problem) is calculated?
Take a look at the JSON of a problem which is composed of two events below. To save your time here is the data:
ProblemStartTime is 1594278660000 - 7/9/2020, 3:11:00 PM
ProblemEndTime is 1594279500000 - 7/9/2020, 3:25:00 PM
Event-1-StartTime is 1594278660000 - 7/9/2020, 3:11:00 PM
Event-1-EndTime is 1594279740000 - 7/9/2020, 3:29:00 PM
Event-2-StartTime is 1594278660000 - 7/9/2020, 3:11:00 PM
Event-2-EndTime is 1594279800000 - 7/9/2020, 3:30:00 PM
So the 'Problem 784' lasted for 14 minutes, while the first event - 18 minutes and second -19 minutes.
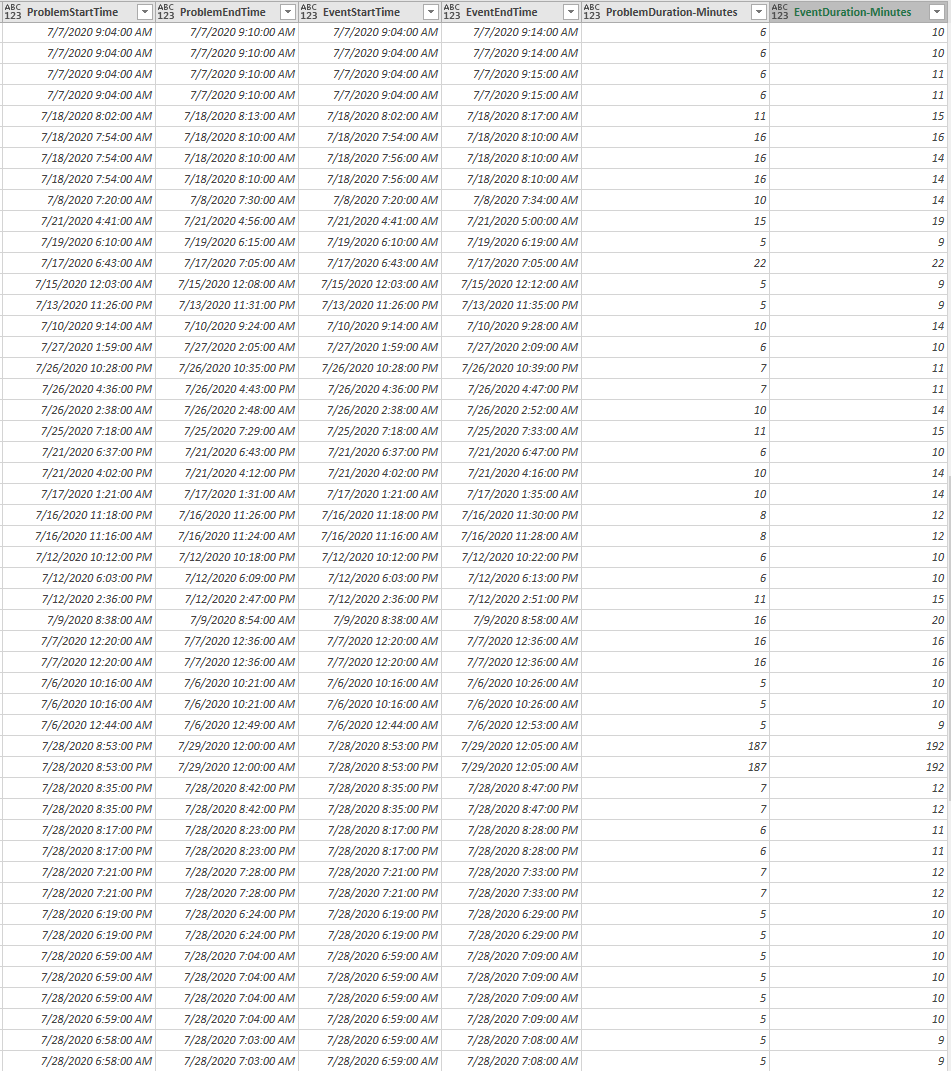
And it is not just one or two events - vast majority are such - I am creating pivot table in excel and you can see the results below.
So my basic question is - what should I beleive? What is real duration of a problem/event?
{
        "displayName": "784",
        "endTime": 1594279500000,
        "hasRootCause": true,
        "id": "909411015521605784_1594278660000V2",
        "rankedEvents": [
          {
            "affectedRequestsPerMinute": 205.4,
            "endTime": 1594279740000,
            "entityId": "SERVICE-570EBC3E4E0CC589",
            "entityName": "Elasticsearch on 0.0.0.0:9200",
            "eventType": "SERVICE_RESPONSE_TIME_DEGRADED",
            "impactLevel": "SERVICE",
            "isRootCause": true,
            "percentile": "90th",
            "referenceResponseTime50thPercentile": 77644,
            "referenceResponseTime90thPercentile": 494630.22,
            "service": "Elasticsearch on 0.0.0.0:9200",
            "serviceMethodGroup": "Dynamic web requests",
            "severities": [
              {
                "context": "RESPONSE_TIME_50TH_PERCENTILE",
                "unit": "MicroSecond (µs)",
                "value": 89579
              },
              {
                "context": "RESPONSE_TIME_90TH_PERCENTILE",
                "unit": "MicroSecond (µs)",
                "value": 34136184
              }
            ],
            "severityLevel": "PERFORMANCE",
            "startTime": 1594278660000,
            "status": "CLOSED"
          },
          {
            "affectedRequestsPerMinute": 96.8,
            "endTime": 1594279800000,
            "entityId": "SERVICE-570EBC3E4E0CC589",
            "entityName": "Elasticsearch on 0.0.0.0:9200",
            "eventType": "SERVICE_RESPONSE_TIME_DEGRADED",
            "impactLevel": "SERVICE",
            "isRootCause": true,
            "percentile": "50th",
            "referenceResponseTime50thPercentile": 279060,
            "referenceResponseTime90thPercentile": 1606498.4,
            "service": "Elasticsearch on 0.0.0.0:9200",
            "serviceMethod": "/_bulk",
            "severities": [
              {
                "context": "RESPONSE_TIME_50TH_PERCENTILE",
                "unit": "MicroSecond (µs)",
                "value": 22973652
              },
              {
                "context": "RESPONSE_TIME_90TH_PERCENTILE",
                "unit": "MicroSecond (µs)",
                "value": 42350192
              }
            ],
            "severityLevel": "PERFORMANCE",
            "startTime": 1594278660000,
            "status": "CLOSED"
          }
        ],
        "startTime": 1594278660000,
        "status": "CLOSED"
      }
Solved! Go to Solution.
Labels:
- Labels:
-
problem detection
3 REPLIES 3
Options
- Mark as New
- Subscribe to RSS Feed
- Permalink
03 Aug 2020 02:03 PM
So Dynatrace alerted you of the problem and the event continued even after the problem was closed. this can be due to a number of things 1- someone manually closed the problem. 2- This issue has been ongoing and will be added to the baseline. 3- The response time in which was triggering event for the alert has fallen down back into the threshold.
If you feel that this is an error, can you share with us what Oneagent version you are running and what cluster version you are on?
-Chad
Reply
Options
- Mark as New
- Subscribe to RSS Feed
- Permalink
03 Aug 2020 03:14 PM
Chad, first, thanks for the answer. Let me go thru your possible options:
1. Not really. Most alerts/events are reporting into the external ticketing system only if the issue has been going on for >25 minutes, the majority of these discrepancies are in the 0-50 min range.
2. If it is the case or the is noise, then should/is some kind of indication (tag, etc) allowing ignoring it?
3. Mmm... didn't quite get it - that threshold are we talking about? I have a number of cases where Problem duration is 0 (zero), while the events inside it are non-zero.
In terms of error - I have 7 clusters, the number of environments/hosts are >5000 across all clusters. Servers are running relatively new code, just checked - Version 1.196.80.20200709-090917. Oneagents are configured with auto-update. I've just checked three different environments reporting such discrepancy and OneAgent version is 1.195.161 on all of them.
Reply
Options
- Mark as New
- Subscribe to RSS Feed
- Permalink
03 Aug 2020 03:33 PM
Thank you for your reply, That is good that your environment is all updated. the only indication that it is ignoring it - would be at the process/service level where the response time is being degraded- in the UI you will see it marked as a frequent Issue.
That threshold is the baseline, where AI Determines an issue when it rises outside of the threshold. The slowdown could have gone back down, back into the threshold but the event that caused the slowdown might still be active.
I would recommend opening a support ticket to ensure that this activity is intended and not a bug - just to be 100% positive.
-Chad
Reply
