Turn on suggestions
Auto-suggest helps you quickly narrow down your search results by suggesting possible matches as you type.
- Dynatrace Community
- Dynatrace
- Ask
- Dashboarding
- Managemet zone do not filter service or request widget
Options
- Subscribe to RSS Feed
- Mark Topic as New
- Mark Topic as Read
- Pin this Topic for Current User
- Printer Friendly Page
Options
- Mark as New
- Subscribe to RSS Feed
- Permalink
06 Aug 2020 06:09 PM
Hello
Task:
We have a business service. This service runs on several blocks (on several different hosts).
From the point of view of Business - Service is one and it provides the end-service for users. Practically, different branches of users or different versions of the application can be launched on different blocks.
From the point of view of Suppor and Operation - they need to evaluate the work of different block and for the whole service
Action:
We have created a dashboard.
Added service and service&request widgets
Created a managemet zone by block and by whole service
Problem:
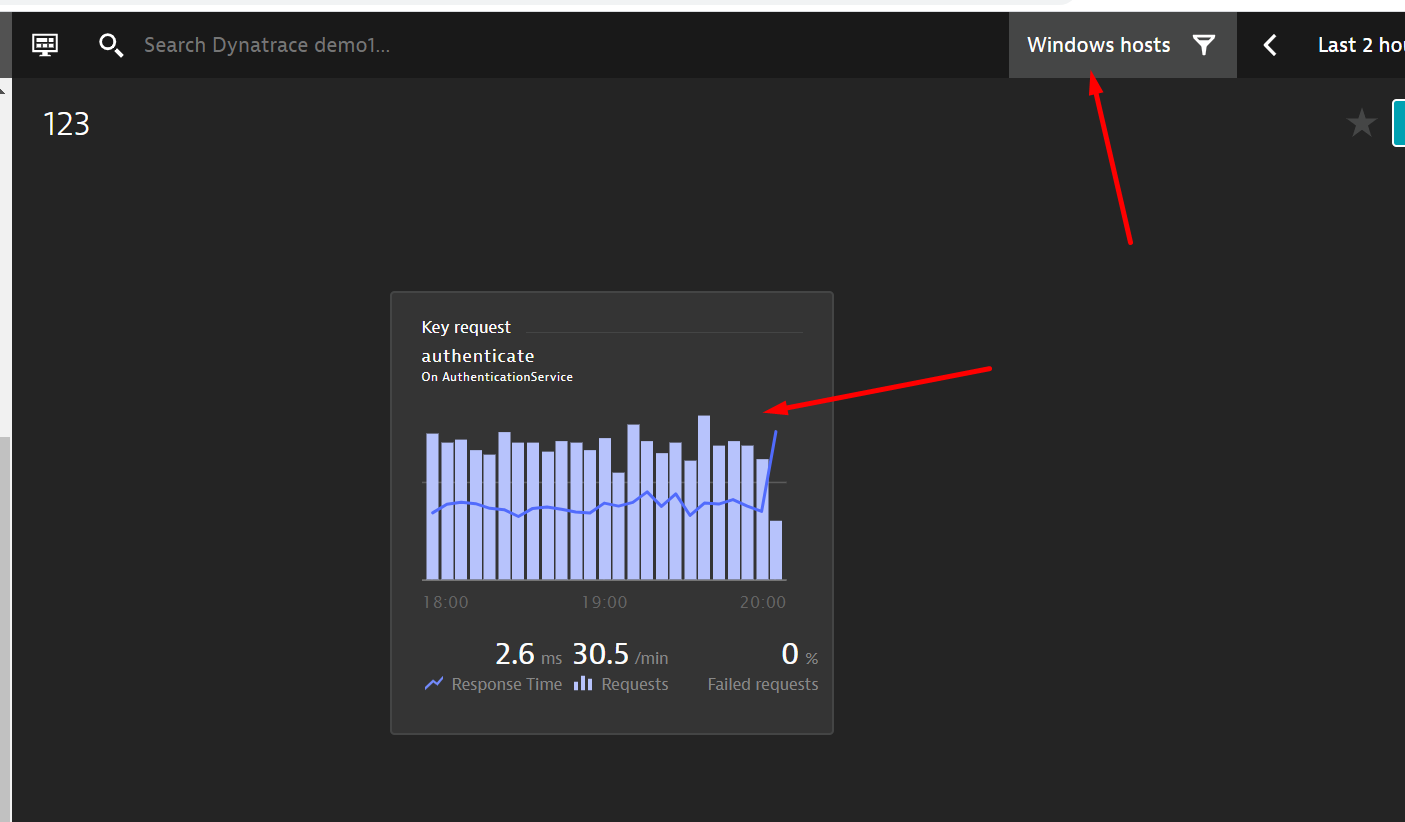
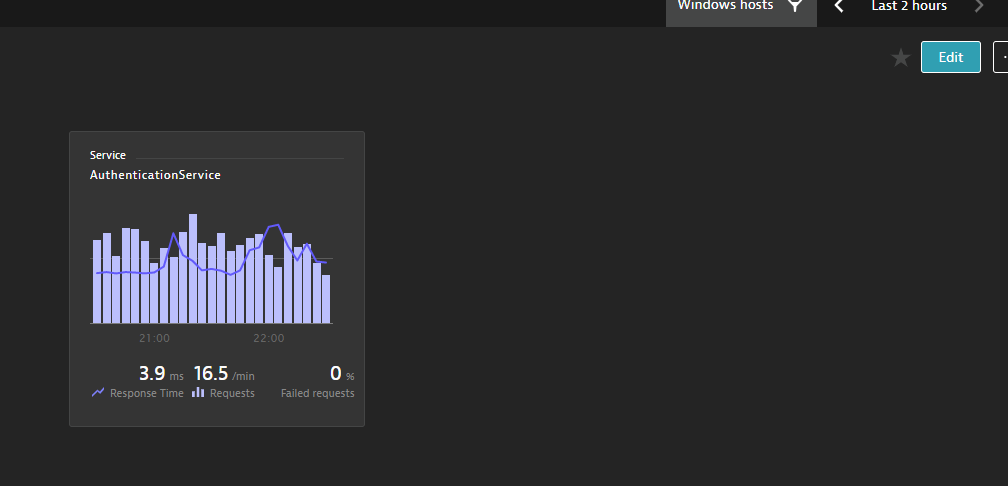
1. Management zone do not filter service&request widgets
it does not filter it even if you select a management zone simply by infrastructure hosts
Examle - MZ = only Windows but service is displaing!
2. Managet zone by block control do not work.
If I select different Managemt Zone by blocks and add service metrics to the custom chart, they are not filtered when zones are selected
Could you please tell me is it a bug or am I doing something wrong ?
Solved! Go to Solution.
Labels:
7 REPLIES 7
Options
- Mark as New
- Subscribe to RSS Feed
- Permalink
06 Aug 2020 06:29 PM
For that Key Request, I can confirm that the Management zones will not change the data for it. For other custom charts and so on, they will change dynamically per the MZ Selected.
-Chad
Options
- Mark as New
- Subscribe to RSS Feed
- Permalink
06 Aug 2020 08:29 PM
Could you tell me the dates when it will be improved?
Options
- Mark as New
- Subscribe to RSS Feed
- Permalink
06 Aug 2020 08:35 PM
for service it also did not work
Options
- Mark as New
- Subscribe to RSS Feed
- Permalink
06 Aug 2020
09:19 PM
- last edited on
12 Feb 2024
10:50 AM
by
![]() IzabelaRokita
IzabelaRokita
I dont think there is a date for this functionality. I would recommend tossing in a RFE for it: https://community.dynatrace.com/t5/forums/postpage/board-id/DynatraceProductIdeas
-Chad
Options
- Mark as New
- Subscribe to RSS Feed
- Permalink
06 Aug 2020 08:56 PM
It is not working for service metrics.
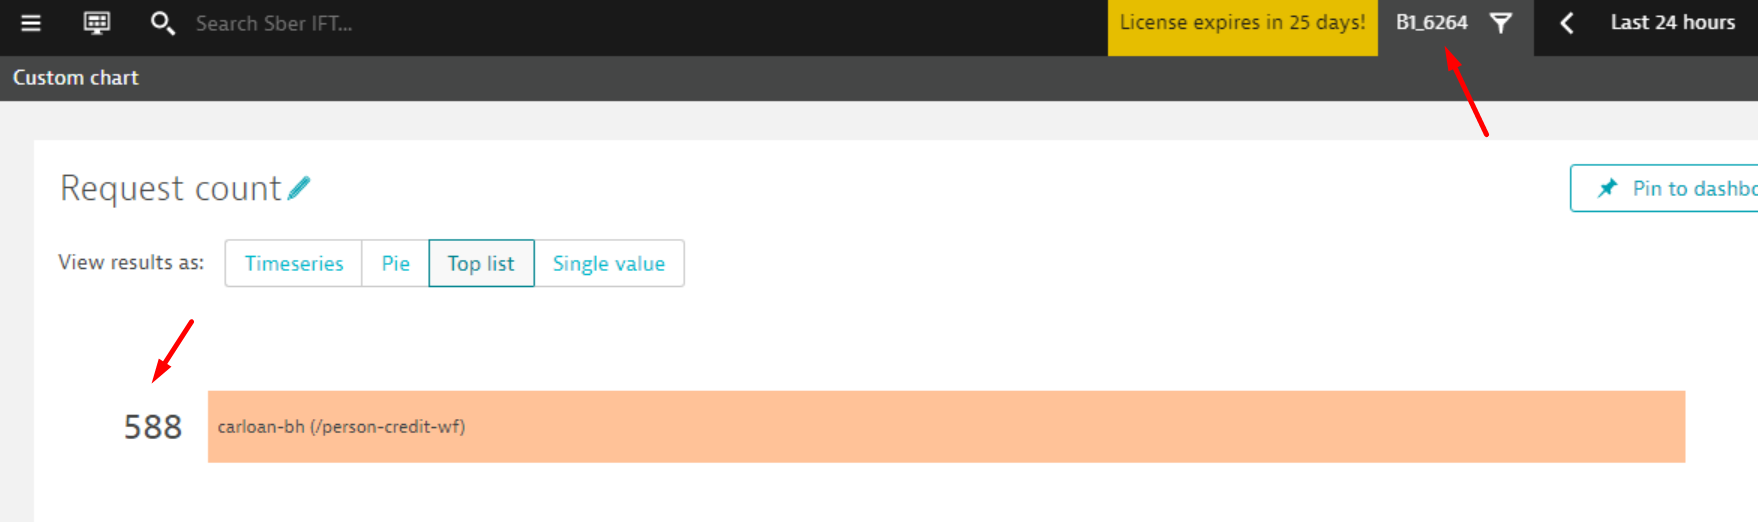
For examples service request count:
mz1 for host 1 for metric request count = 588
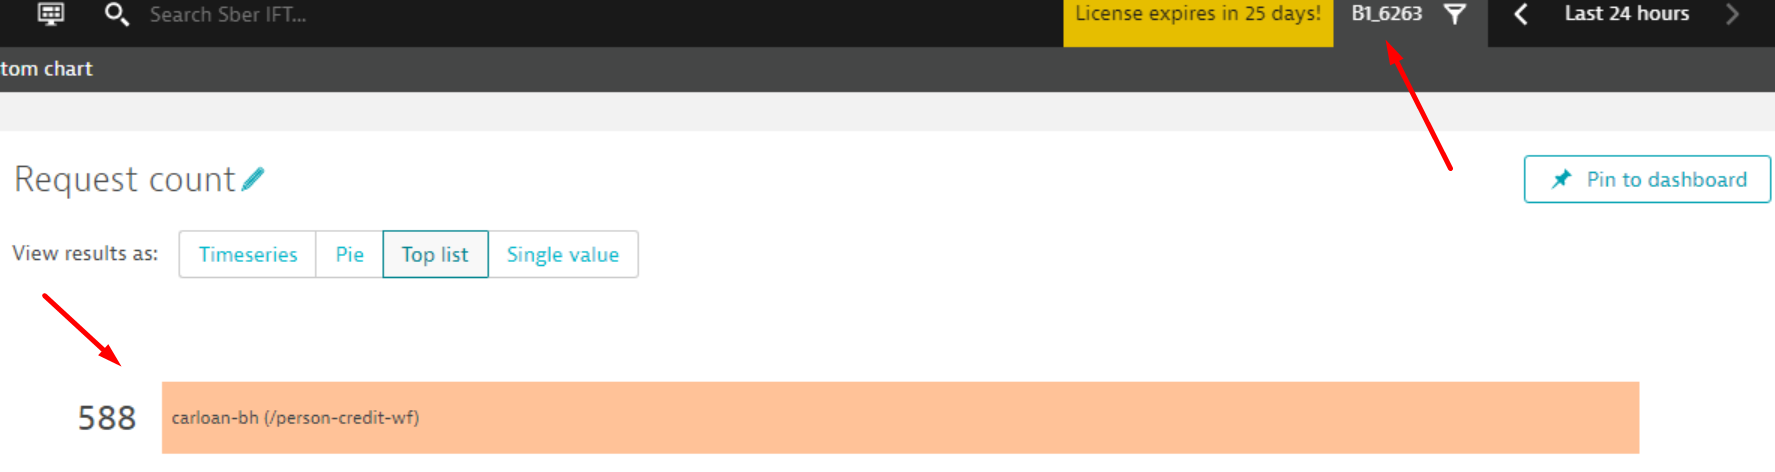
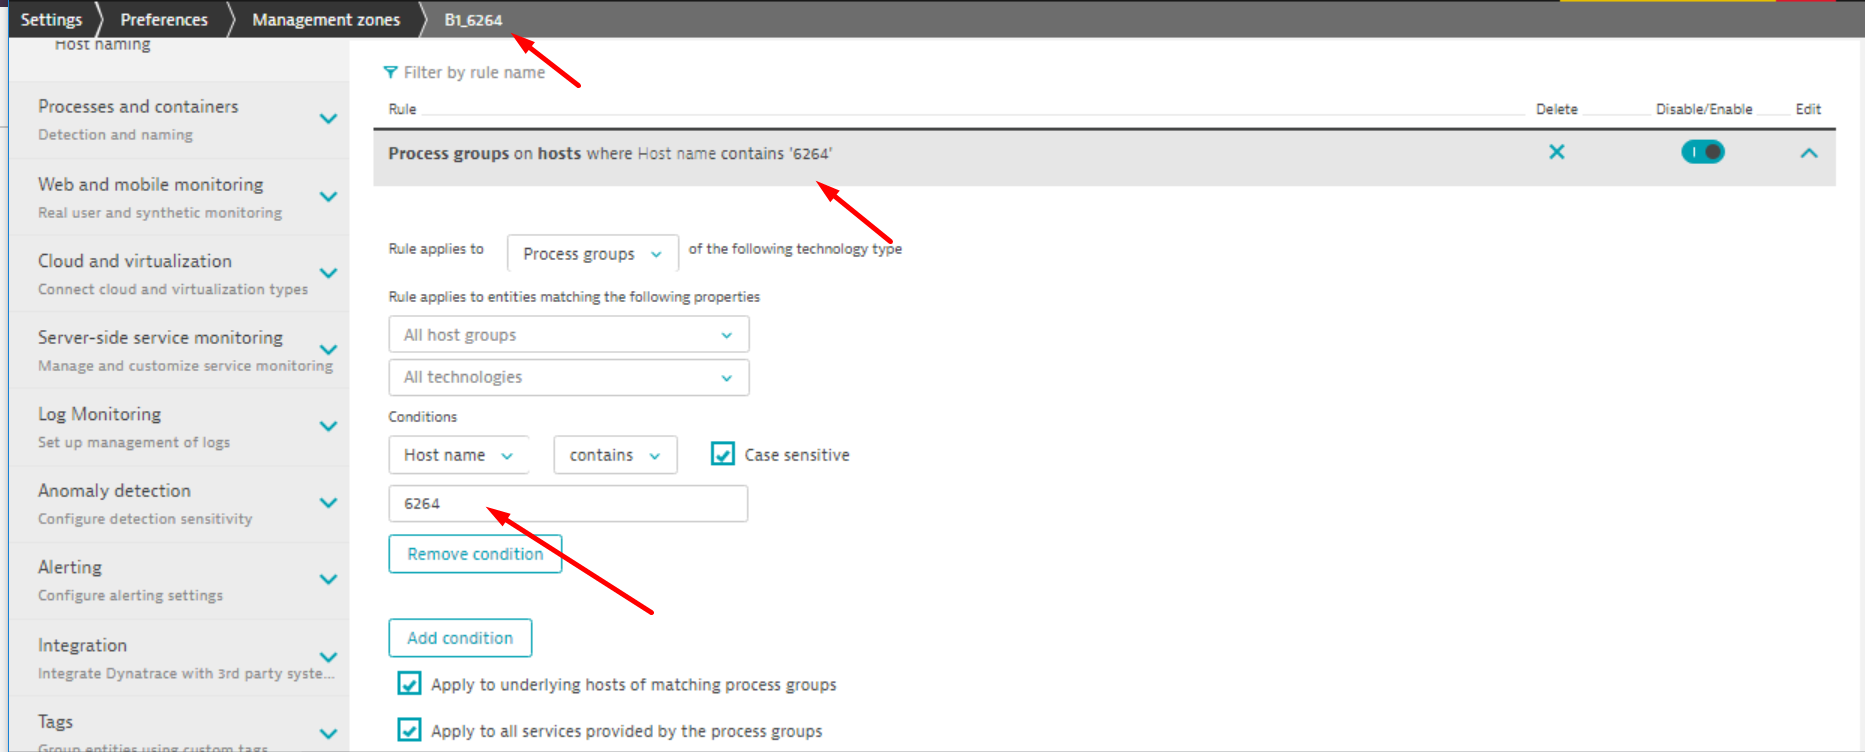
settings MZ1
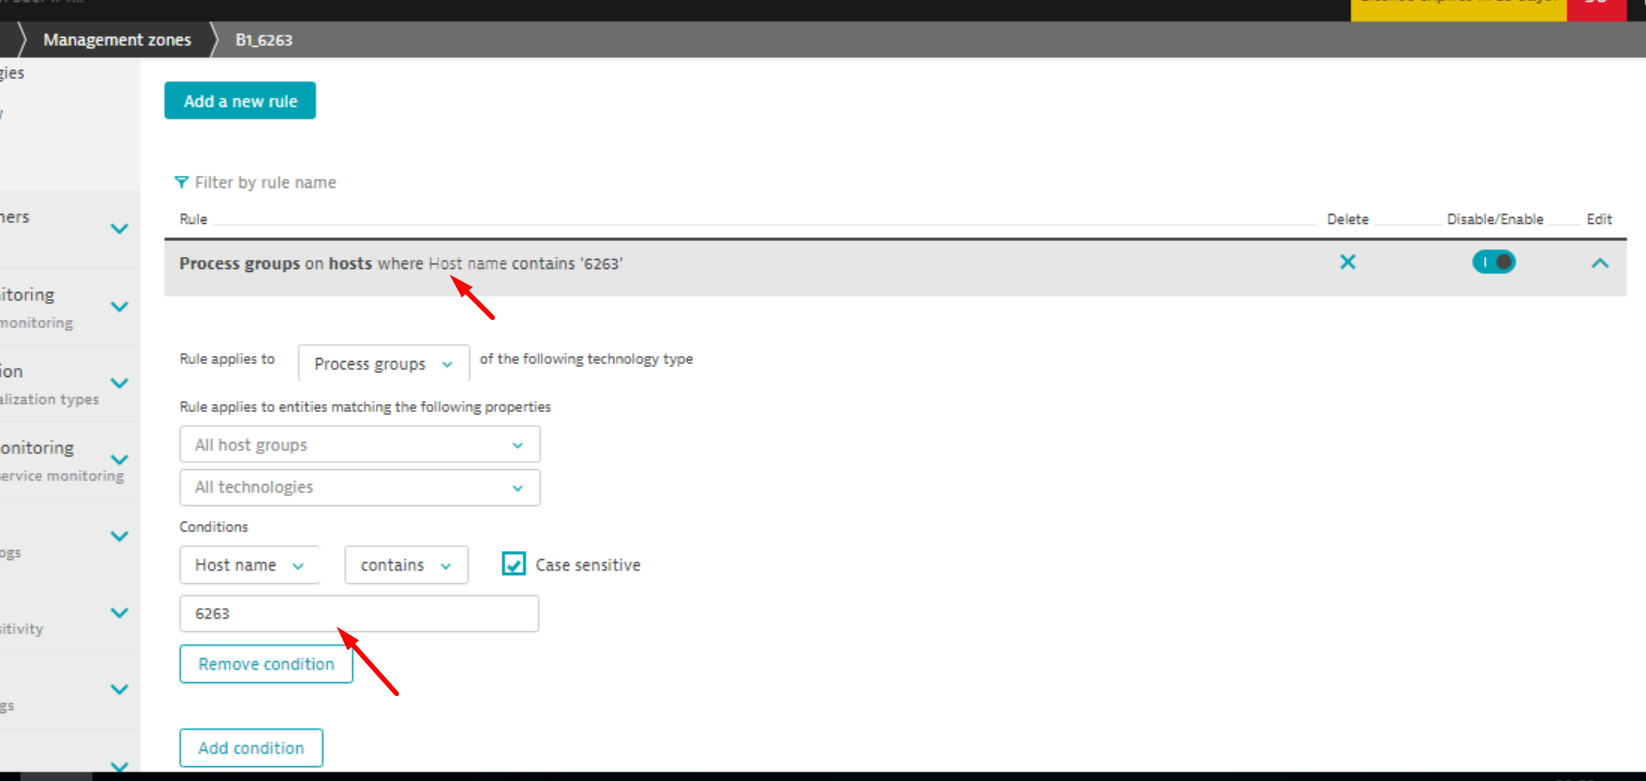
mz2 for host 2 for metric request count = 588
settings MZ2
Options
- Mark as New
- Subscribe to RSS Feed
- Permalink
07 Aug 2020 08:29 AM
Hi Mikhail,
I would like to give you a bit more context for what is happening. In the Dynatrace world of entity mapping, we create some logical groupings for related entities. We have the direct (tangible) mapping of Host > Process > Service Instance. However, within the same host group, if we see the same Process running on multiple hosts we will create some more (logical) groupings: Process Group (a logical group of all related Process entities from the same host group) and Service (all related Service Instances from the same Process Group).
Here's a diagram to help visualise it (blue are tangible entities, purple are logical groupings):
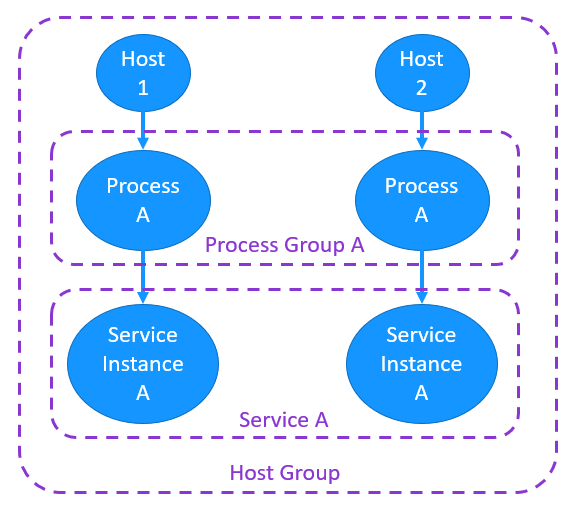
With this in mind, when you are creating Management Zones, take note of what entities you are applying it to; the rules work with Process Groups and Services which will inadvertedly contain multiple Processes and Service Instances. Hence even if you have regular charts, you are not able to work with the filtering per instance or per Process.
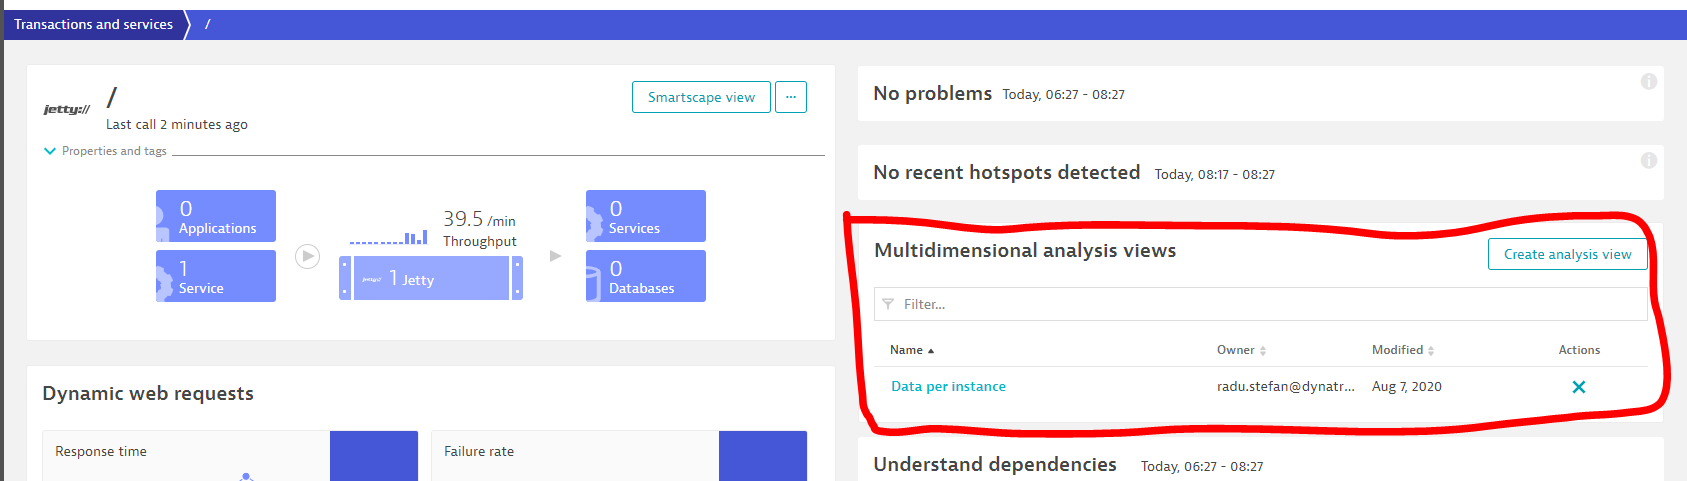
What I would recommend for your dashboarding requirements is to create either a Multi Dimensional Analysis view which allows you to split the data per Service Instance, or use the existing Service Details view and add a filter by Service Instance. Neither of these can be displayed directly on a dashboard, but both of them can be referenced by links. So you can have your general Service/Request chart on the dashboard, and links next to it to drill down to the more granular views.
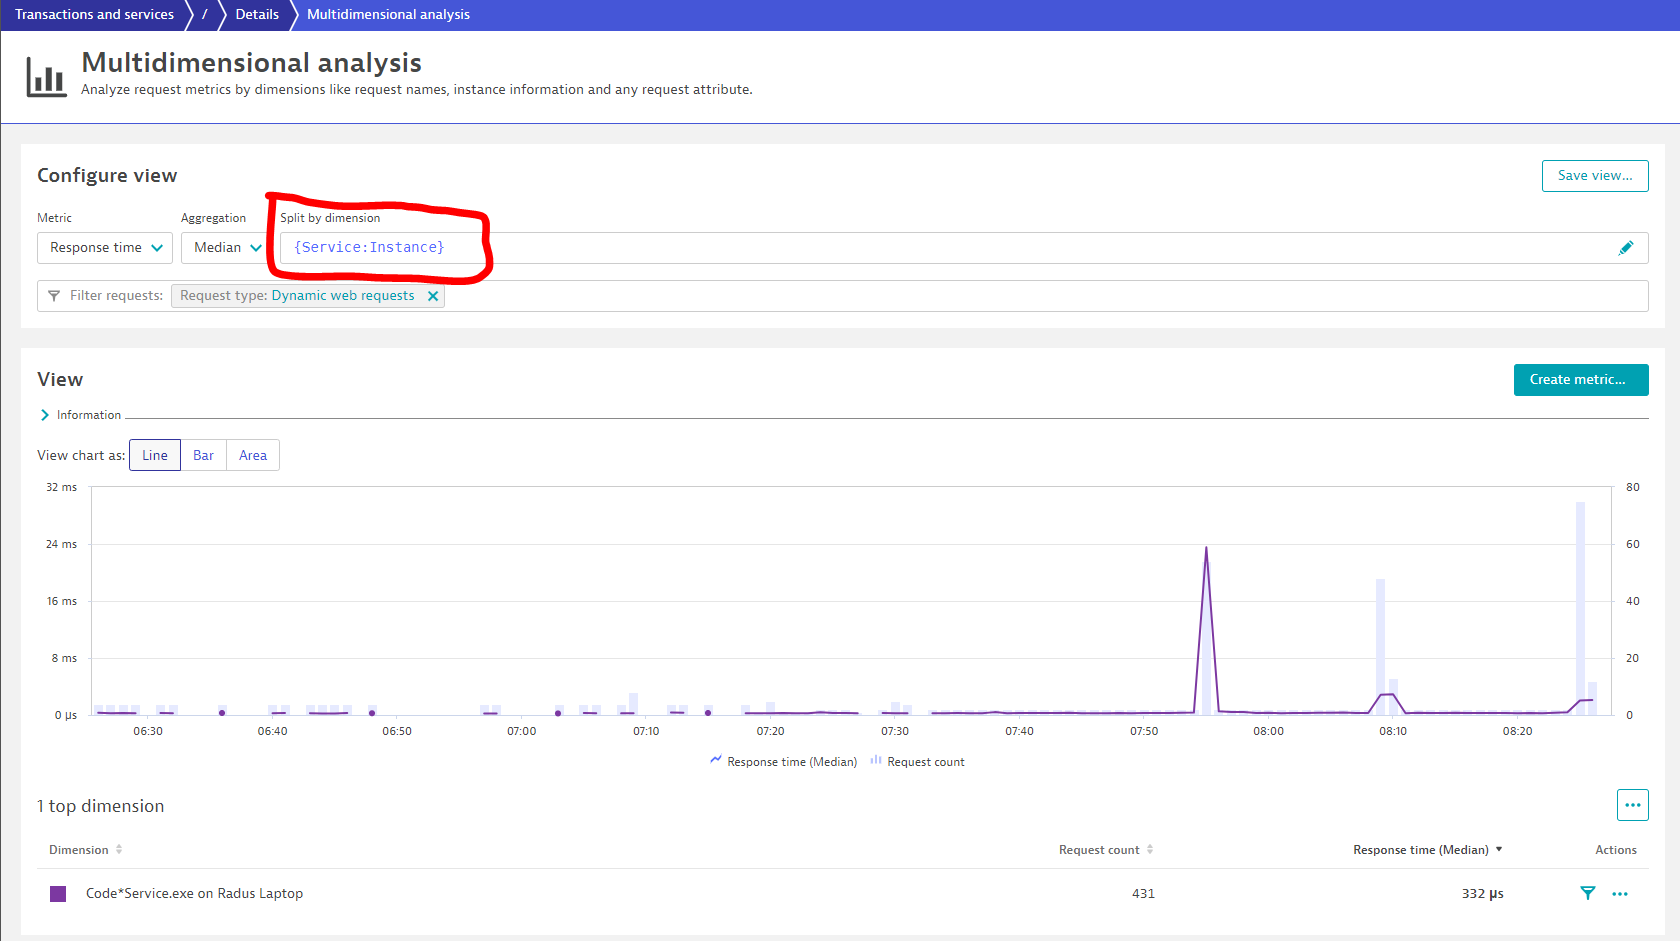
With the Multi Dimensional Analysis view, you have the advantage that other team members will also be able to access it from the Service's overview page instead of requiring access to the dashboard.
I hope this helps.
Best regards,
Radu
Reply
Options
- Mark as New
- Subscribe to RSS Feed
- Permalink
07 Aug 2020 11:26 AM
thanks for this clarification.
Think I need to think about creating the RFE. The ability to easily filter requests on the dashboard is very necessary for business and support
