• Forums
    • Public Forums
      • Community Connect
      • Dynatrace
        • Dynatrace Open Q&A
      • Application Monitoring & UEM
        • AppMon & UEM Open Q&A
      • Network Application Monitoring
        • NAM Open Q&A
  • Home /
  • Public Forums /
  • Dynatrace /
  • Dynatrace Open Q&A /
avatar image
Question by Michaå‚ L. · Dec 01, 2020 at 09:14 AM · Dynatrace Managed host monitoring documentation error reporting knowledge sharing

Difference between automatic and fixed thresholds

Hello,

I would like to know how exactly automatic alerting works. There is often question how it works and after few different accident, exploring documentation and support ticket opening(for specific cases) I have feeling that something is missing in my knowledge. In anomaly detection settings on infrastructure page there are few different settings.

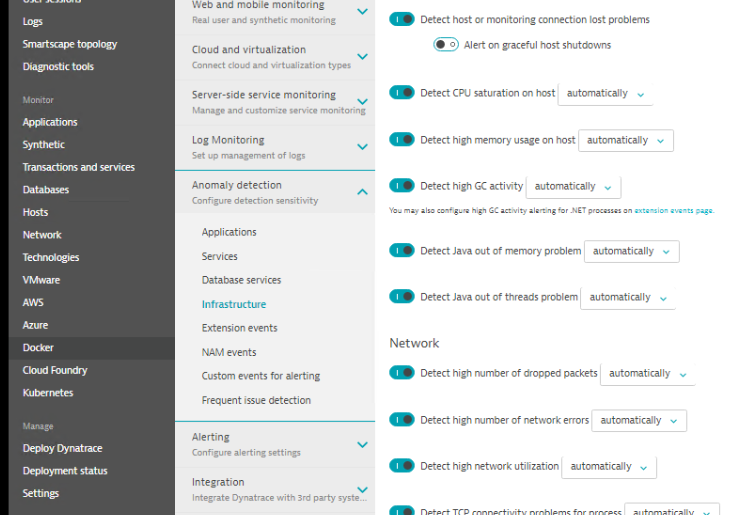
First example CPU saturation on host, if it's set automatically it will rise alert if default threshold(95%) is exceed? If it's true it could be fixed anyway at 95% and there is no need to name it automatically.

Second example is more important for me.

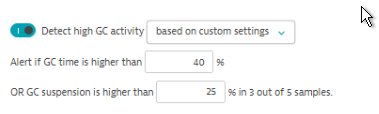
Based on custom settings there are two parameter and one of them needs to be exceeded to rise an alert.

But if it set to automatically only first parameter is taken to rise an alert and second one is ignored - is this true and if it is why?

What about other setting which has two parameter inside? Only first one is taken in automatic mode?

I will be grateful if someone dispel my doubts.

Michał

1606813327619.png (156.3 KiB)
1606813428448.png (14.7 KiB)
Comment

People who like this

0 Show 0
10 |2000000 characters needed characters left characters exceeded
  • Viewable by all users
  • Viewable by moderators
  • Viewable by moderators and the original poster
  • Advanced visibility
Toggle Comment visibility. Current Visibility: Viewable by all users

Up to 10 attachments (including images) can be used with a maximum of 50.0 MiB each and 250.0 MiB total.

2 Replies

  • Sort: 
  • Most voted
  • Newest
  • Oldest
avatar image
Best Answer

Answer by Wolfgang B. · Dec 01, 2020 at 11:14 AM

Hi Michal,

You are completely right, in the current infra sections our 'automatic' in most cases simply means we do decide on the threshold we would like to apply, while if you override it with your static threshold you decide on the threshold.

Side note: if you want an adaptive baseline you have to use the 'Custom events for alerting' section where you can opt-into a baseline also for infrastructure metrics.

Automatic also means that we can at any point in time decide to change the static threshold into a default baseline in the future, wherever we think it would be beneficial.

Concerning your second question, its a logic OR combination, which means whatever violates first is triggering the event. There are also some logic ANDs hidden in that section, e.g.: Memory alerting where we use the Mem free condition AND number of page faults. In a logic AND combination, both conditions have to violate to raise the event.

Best greetings,

Wolfgang

Comment

People who like this

0 Show 0 · Share
10 |2000000 characters needed characters left characters exceeded
  • Viewable by all users
  • Viewable by moderators
  • Viewable by moderators and the original poster
  • Advanced visibility
Toggle Comment visibility. Current Visibility: Viewable by all users

Up to 10 attachments (including images) can be used with a maximum of 50.0 MiB each and 250.0 MiB total.

avatar image

Answer by Michaå‚ L. · Dec 01, 2020 at 01:28 PM

Hi Wolfgang,

thanks for you answer. I have only last doubt about raising alerts with two condition. I've got an information if high GC activity is set automatically only GC Time is taken and suspension time is ignored. To raise an alert to suspension event you need to set custom setting.

Is it true or was in the past?

Best Regards

Michał

Comment

People who like this

0 Show 0 · Share
10 |2000000 characters needed characters left characters exceeded
  • Viewable by all users
  • Viewable by moderators
  • Viewable by moderators and the original poster
  • Advanced visibility
Toggle Comment visibility. Current Visibility: Viewable by all users

Up to 10 attachments (including images) can be used with a maximum of 50.0 MiB each and 250.0 MiB total.

How to get started

First steps in the forum
Read Community User Guide
Best practices of using forum

NAM 2019 SP5 is available


Check the RHEL support added in the latest NAM service pack.

Learn more

LIVE WEBINAR

"Performance Clinic - Monitoring as a Self Service with Dynatrace"


JANUARY 15, 3:00 PM GMT / 10:00 AM ET

Register here

Follow this Question

Answers Answers and Comments

32 People are following this question.

avatar image avatar image avatar image avatar image avatar image avatar image avatar image avatar image avatar image avatar image avatar image avatar image avatar image avatar image avatar image avatar image avatar image avatar image avatar image avatar image avatar image avatar image avatar image avatar image avatar image avatar image avatar image avatar image avatar image avatar image avatar image avatar image

Related Questions

Uninstall Dynatrace Managed Completely

best practices for dynatrace managed

Dynatrace and sharepoint 2013

windows 2003 for dynatrace managed is possible?

Security Gateway Load Balancing

Forum Tags

mobile monitoring dotnet iis chat kubernetes servicenow amazon web services feedback mysql mainframe application rules rest api cassandra dashboard oneagent sdk cmc waterfall chart application monitoring openkit smartscape request attributes monitoring developer community user tagging log monitoring services ufo opentelemetry integrations activegate auto-detection high five award uem webserver usql iib test automation license ios news migration management zones ibm mq web services notifications sso host monitoring knowledge sharing reports browser monitors java hybris sap vmware maintenance window user action naming resource javascript appmon ai availability tipstricks automation extensions diagnostic tools session replay permissions search davis assistant auto-update faq documentation problem detection http monitors easytravel apdex network docker tags and metadata cloud foundry google cloud platform synthetic monitoring lambda process groups account usability dynatrace saas gui paas openshift key user actions administration production user actions postgresql synthetic locations upgrade oneagent security Dynatrace Managed user management python technologies mongodb openstack user session monitoring continuous delivery citrix configuration alerting performance monitoring NGINX action naming geolocation linux nam installation error reporting database mission control apache slo mobileapp RUM php azure purepath davis scripting aix nodejs android
  • Forums
  • Public Forums
    • Community Connect
    • Dynatrace
      • Dynatrace Open Q&A
    • Application Monitoring & UEM
      • AppMon & UEM Open Q&A
    • Network Application Monitoring
      • NAM Open Q&A