Turn on suggestions
Auto-suggest helps you quickly narrow down your search results by suggesting possible matches as you type.
- Dynatrace Community
- Dynatrace
- Ask
- Dashboarding
- Total traffic by node - chart
Options
- Subscribe to RSS Feed
- Mark Topic as New
- Mark Topic as Read
- Pin this Topic for Current User
- Printer Friendly Page
Options
- Mark as New
- Subscribe to RSS Feed
- Permalink
21 Dec 2020 08:30 PM
One of the metrics we track is total service executions, by node. I have an management zone filter for my machines, but I can't seem to figure out how to get the builtin:service.requestCount.server metric to breakout per node. As well, historically I was able to use the same to get the average response time and that does not appear to be available.
Solved! Go to Solution.
Labels:
- Labels:
-
dashboards classic
-
services
3 REPLIES 3
Options
- Mark as New
- Subscribe to RSS Feed
- Permalink
24 Dec 2020 03:07 PM
David, you are correct. The ability to see a set of hosts and a for each hosts with the overall services on that host, is currently not available in Dynatrace. You can toss in a RFE. What you can do as a work around is create an AutoTag for Host Name: with a dynamic value of the detected host name. You can also trickle this down to the services, processes and so on. Once Created and the tag is applied, you can then go into your tile and select a single host.
You can also have your Management Zone set as well to limit the number of servers to select from. Ideally, you'd want to see a top list, to get a good overview of the ranking of the 10 hosts in a management zone. But that cant be done at this time in the UI. You'd have to create a single tile for each host included in the Management Zone which can be cumbersome.
-Chad
Options
- Mark as New
- Subscribe to RSS Feed
- Permalink
28 Dec 2020 09:31 PM
@Chad T., So, if I understand that correctly, if I need daily statistics for X machines, I need a dashboard with 2X tiles, so I can get average service execution time and total service calls?
I don't care if it's cumbersome as long as I can make a static dashboard for it.
My concern is that I have 2 distinct processes running on the node and I need to track them individually. This was easy in AppMon, because each had an agent, and I could sort/filter report by agent.
TIA,
David
Options
- Mark as New
- Subscribe to RSS Feed
- Permalink
28 Dec 2020 10:05 PM
for metrics at the level you are looking to get them... Yes. Just make sure you title each graph clearly and concise to ensure no confusion as to what the user is looking at and on what host.
Just to be clear, you can add on multiple metrics into one chart. You refenced having Average Service Execution and Total Service calls. This can be represented in a singular graph, this representation will need to be refined to a singular host. Thus creating X amount of the same tiles (having both Service Execution and Total Service Calls metrics) for the X amount of hosts and or processes that make up your application or Host Group or Management Zone.
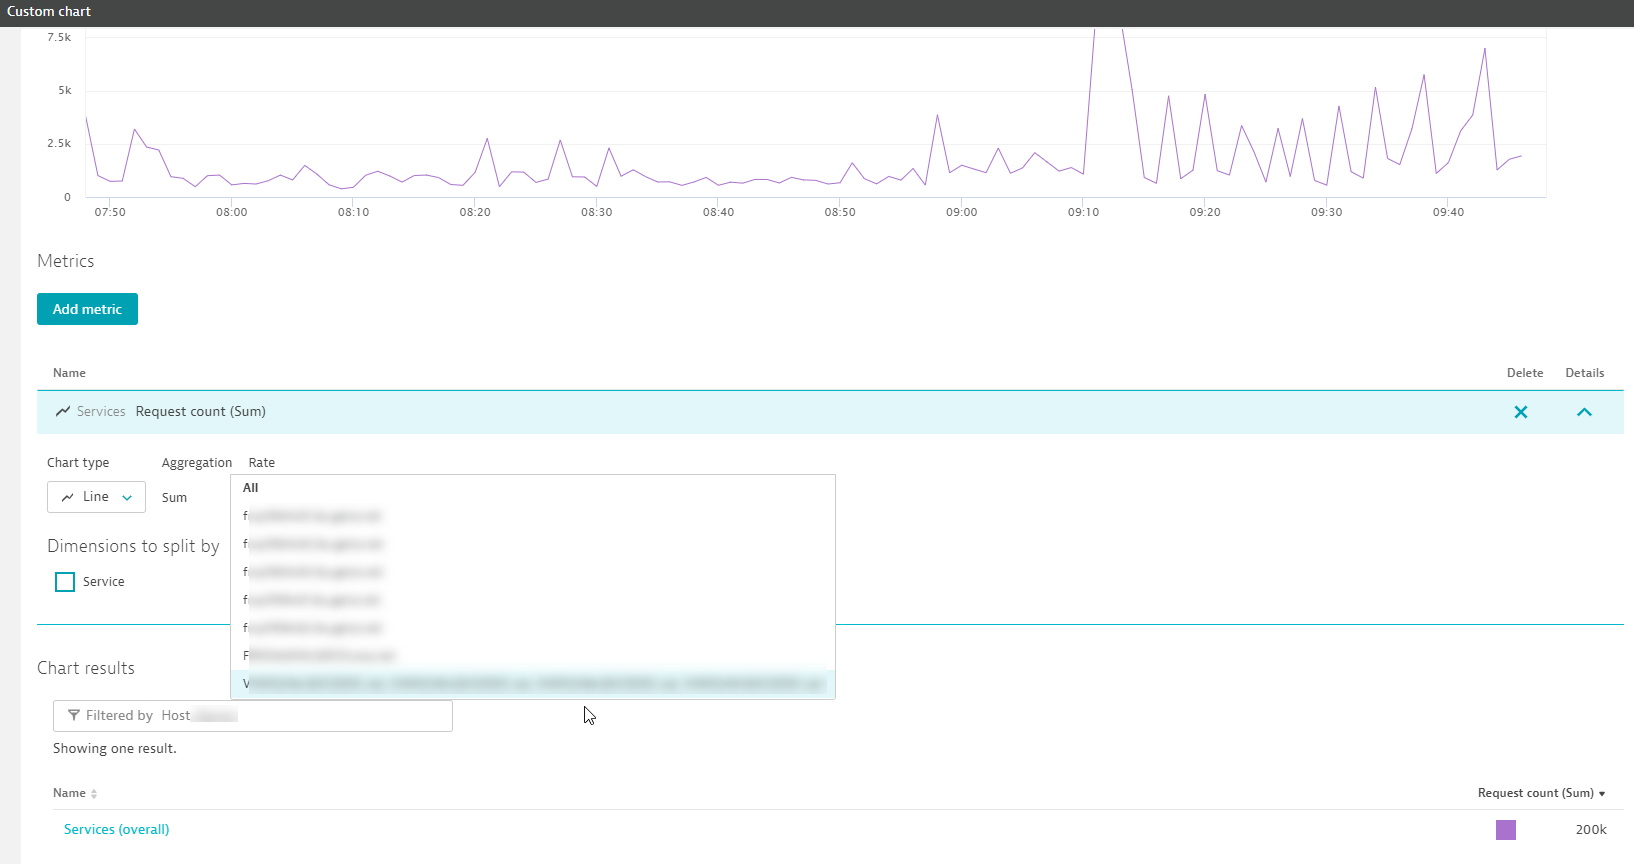
You can filter down to the singular service. As you stated its two services on one host. Unless you tag them with the same tag, either manually or automatically, then you will need to create two custom charts (create one and clone the other and just pick the other service) and have them filtered down to that service.
If you want it to be singular service by node, then you will need to do what you did above, but also add in a filter to isolate the host as desired.
EX: If wanted Process E and Process F charted, id create a custom chart and add the two variables I'm looking to show (Execution time and total calls) then I would filter it down to Process E or F, or if I'm okay with having them combined, I can filter it down to a tag that resides on both processes say tag: Process E&F. This would eliminate having a tile for each process E and F. But if you want them separated, then yes do two charts.
Now if you want to add host level filtering, then we would just add to the tile or tile(s) you just created. So Tile with E&F combined, you would add a filter for Host A and save it/update the existing tile. Now if you want to see the data on Host B, then you would need to clone the tile and change the Host filter from A to B. Same goes for Process E&F if you broke them our individually.
I hope this clears things up, let me know
-Chad
