Turn on suggestions
Auto-suggest helps you quickly narrow down your search results by suggesting possible matches as you type.
- Dynatrace Community
- Dynatrace
- Ask
- Dashboarding
- Need assistance to answer these questions
Options
- Subscribe to RSS Feed
- Mark Topic as New
- Mark Topic as Read
- Pin this Topic for Current User
- Printer Friendly Page
Options
- Mark as New
- Subscribe to RSS Feed
- Permalink
08 Jan 2021
07:27 AM
- last edited on
30 Apr 2021
12:52 PM
by
![]() MaciejNeumann
MaciejNeumann
Hi,
I need your assistance to answer these questions.
- How to change the number of samples in static threshold configuration?
- Is there a metric for total web requests sent and received by host?
- How sensitivity in anomaly detection setting work?
- Is it possible to limit the number of top list charts?
Thanks.
Andre
Solved! Go to Solution.
Labels:
- Labels:
-
dashboards classic
3 REPLIES 3
Options
- Mark as New
- Subscribe to RSS Feed
- Permalink
08 Jan 2021 01:35 PM
1.) If you go to a host/Process/Service and so on, you have the ability to select Edit. Once Selected, you will get the configuration settings for that entity which includes Automatic or Static/custom Alerts, If you change an alert to static/custom, you have the ability to change the alert as you see fit.
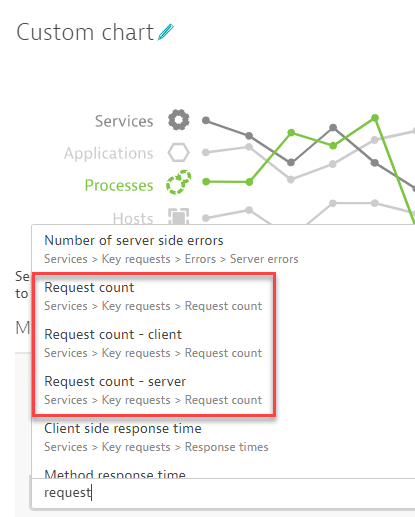
2.) Yes, If you create a custom chart, you can create a tile that contains the following:
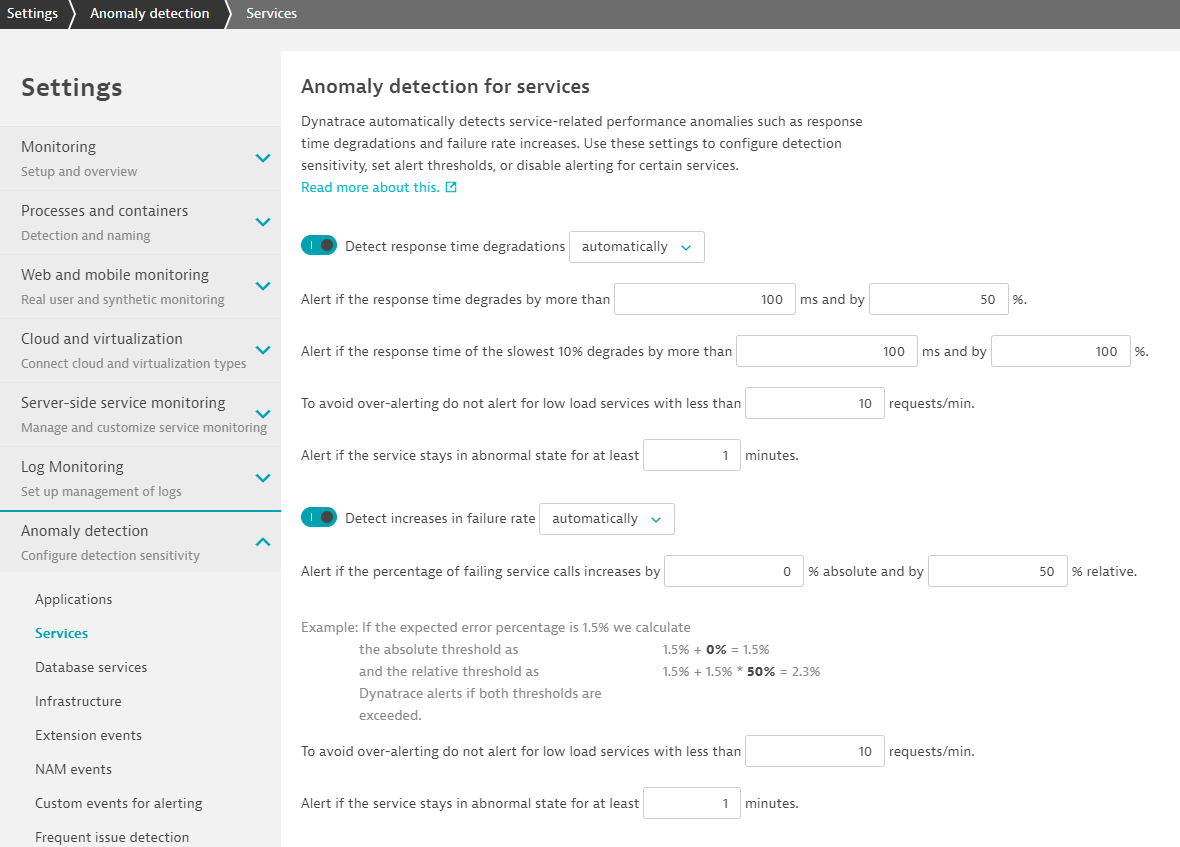
3.) If an entity is set to a automatically let then it will use the Dynatrace AI, Davis, to determine what anomalies will be alerted on. Davis does this by baselining all the previous data from 7 days ago. If CPU typically runs at 20% and then come Friday at 5pm, CPU spikes to 50%, Davis will detect that, compare it to the baseline from the previous days and generate an alert as a 30% increase is a deviation from the baseline. https://www.dynatrace.com/support/help/how-to-use-dynatrace/problem-detection-and-analysis/basic-con...
4.) Tiles are fully configurable, you can adjust the entities that are included in your top list chart by applying filters: 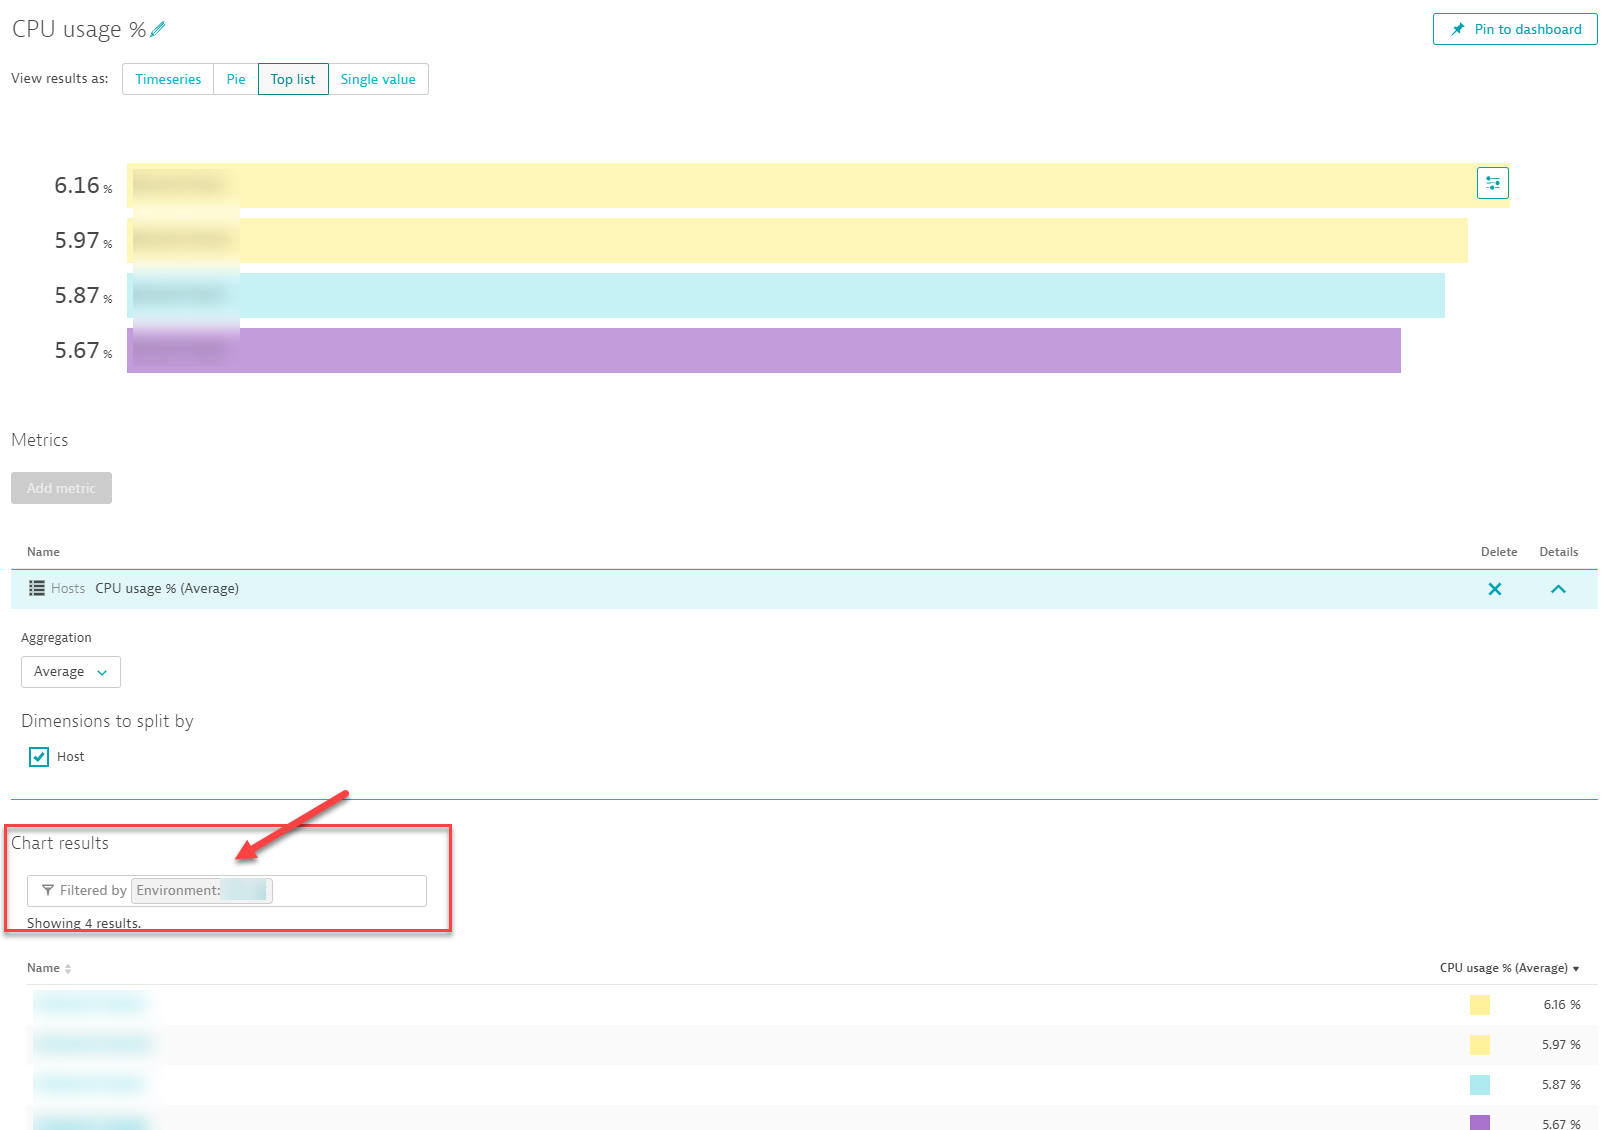
As you can see, I have applied a filter on a tag, and selected the value. In this case I've filtered down by environment = DEMO, now I can see the consumption of cpu by hosts that have the tag Envrionment:DEMO. you can also leverage Management zones too.
-Chad
Reply
Options
- Mark as New
- Subscribe to RSS Feed
- Permalink
11 Jan 2021 04:42 AM
Hi Chad,
Thank you so much for the explanation. I still have a question for number 2 and 3.
2.) I think what I was trying to ask is that can we split the Request Count by Host? We can see Request Count split by Services and Request, but we cannot see the total number of request that processed by Host. Do we have a metric for that? or we have some alternative to solve this request?
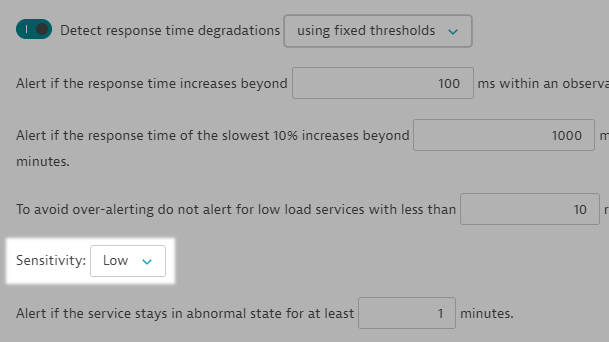
3.) Does that applied to this Sensitivity?
Thanks.
Andre
Options
- Mark as New
- Subscribe to RSS Feed
- Permalink
11 Jan 2021 01:27 PM
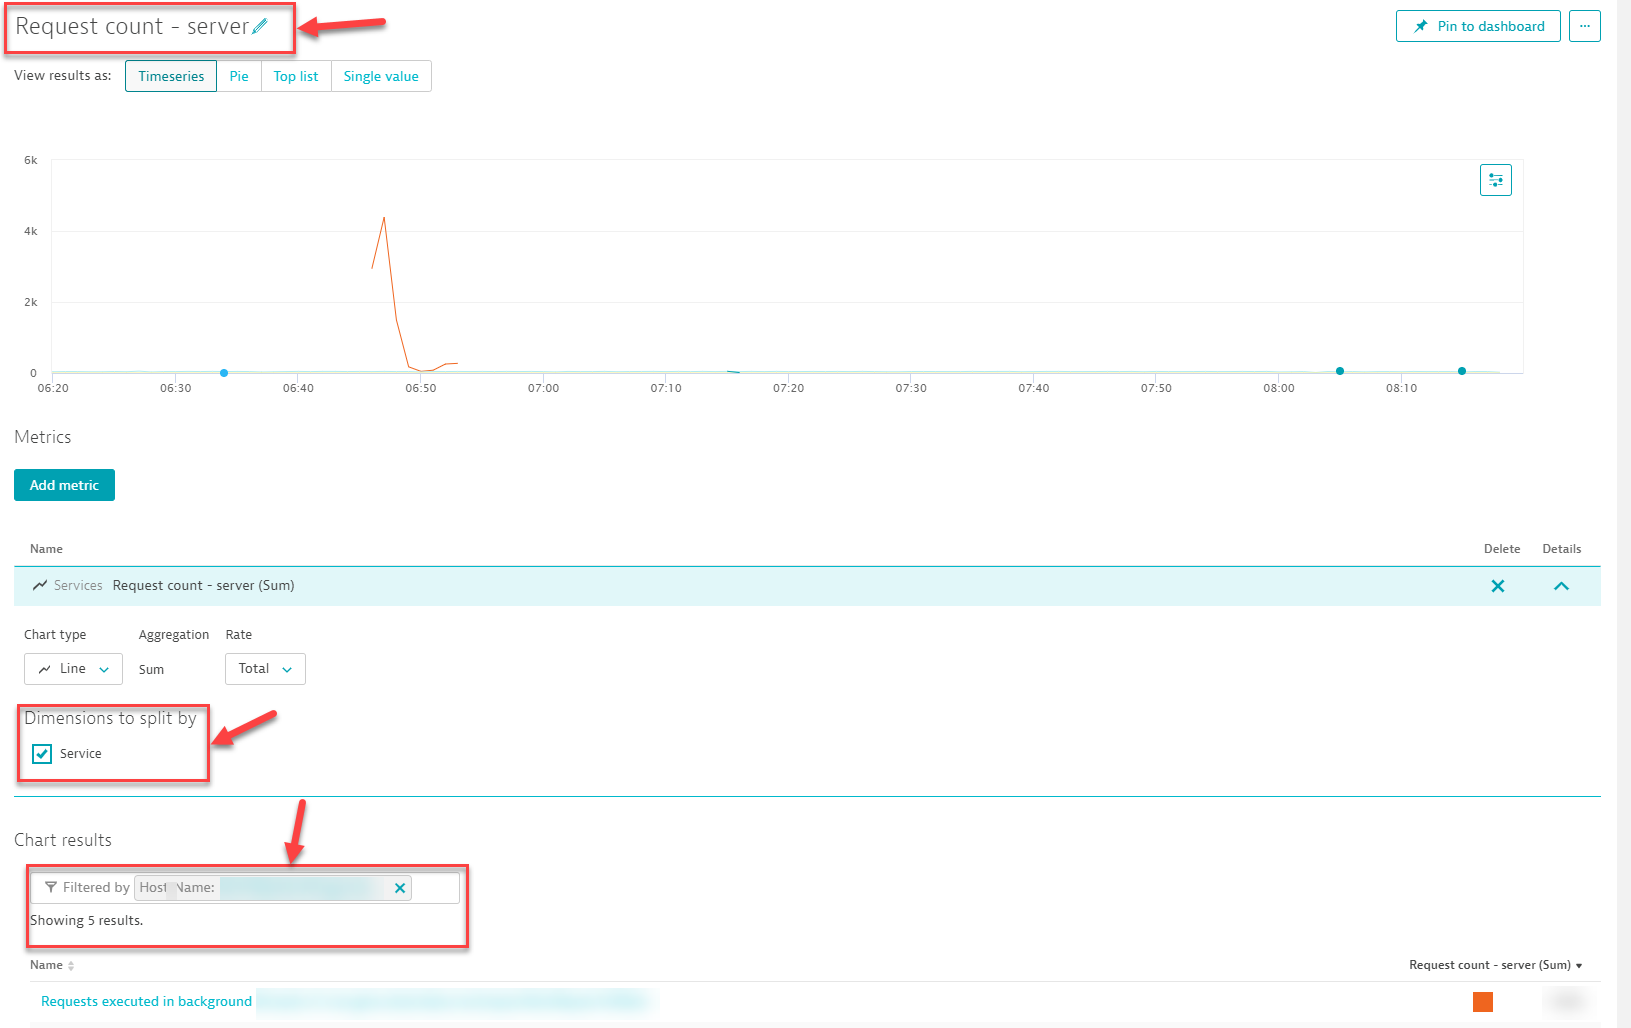
2.) The custom charts wont allow you to split the requests by hosts directly, rather by the services of the requests. A work around for this is to create an automatic tag that, you can call it "Host Name" and the auto tag will provide you with the device/host name. From there you can create a custom chart, looking at the request count, split it by services or keep them grouped overall, then scroll down to the filter and add a filter on the host name and add the host name into the title of your tile:
If you want to alert on this by host, and each host/service might have a different threshold, then I would recommend Custom Events for alerting by going to using Settings>Anomaly Detection>Custom Events for Alerting. From there you can get as granular as you want and alerts will be generated out as static or AI Based.
3.) That sensitivity will result in making the rule you are setting in your screen capture, less strict.
-Chad
