Turn on suggestions
Auto-suggest helps you quickly narrow down your search results by suggesting possible matches as you type.
- Dynatrace Community
- Dynatrace
- Ask
- Open Q&A
- Purepath, blank in execution time graph
Options
- Subscribe to RSS Feed
- Mark Topic as New
- Mark Topic as Read
- Pin this Topic for Current User
- Printer Friendly Page
Purepath, blank in execution time graph
Options
- Mark as New
- Subscribe to RSS Feed
- Permalink
22 Jan 2021 11:57 AM
Hi,
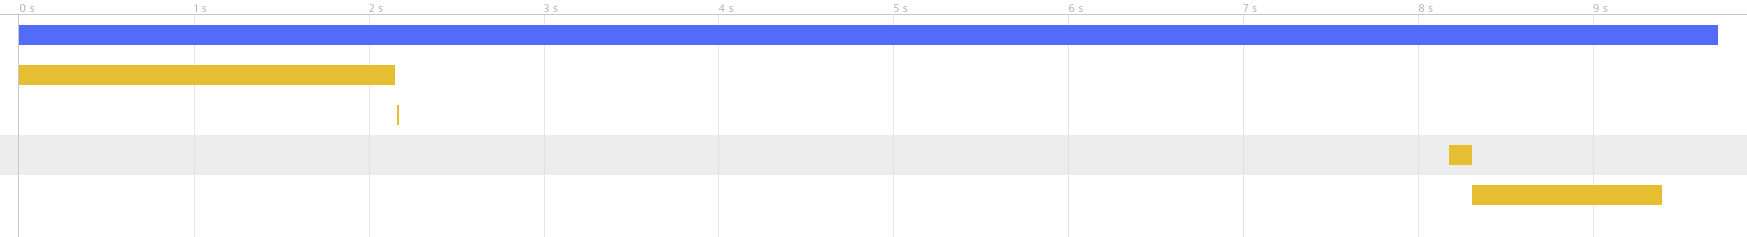
I have been investigating some requests that take an awful long time to finish and in most of them I see the same thing. In PurePath I see long periods where the Execution Time graph is blank. See image below.
To me it seems that nothing is happening, but why? What is the blank space an indication of?
Thanks in advance.
![]()
Labels:
- Labels:
-
distributed traces
-
services
Reply
4 REPLIES 4
Anonymous
Not applicable
Options
- Mark as New
- Subscribe to RSS Feed
- Permalink
22 Jan 2021 12:41 PM
You could see the code insight. at the moment of a long time. But your screenshot shows you have at least 48% suspension in that trace... so might be that.
Options
- Mark as New
- Subscribe to RSS Feed
- Permalink
22 Jan 2021 02:41 PM
Hi Dante, thank you for the reply. Is "code insight" a feature of DynaTrace or do you mean something else by that? 🙂
The 48 % suspension is up to things like Garbage Collection in .Net as far as I know. Do you agree or do you know what if it can be caused by something else?
Options
- Mark as New
- Subscribe to RSS Feed
- Permalink
22 Jan 2021 03:11 PM
When you go to the code level or timing tab It should show additional info. The calls are to the same DB? What you might be able to see there is if there was a lock.
Take this for example:
Also DB calls, in this case
The 6 seconds space is 6seconds of lock in the execution at the moment that calls the
System.Data.SqlClient.SqlConnection (System.Data.dll )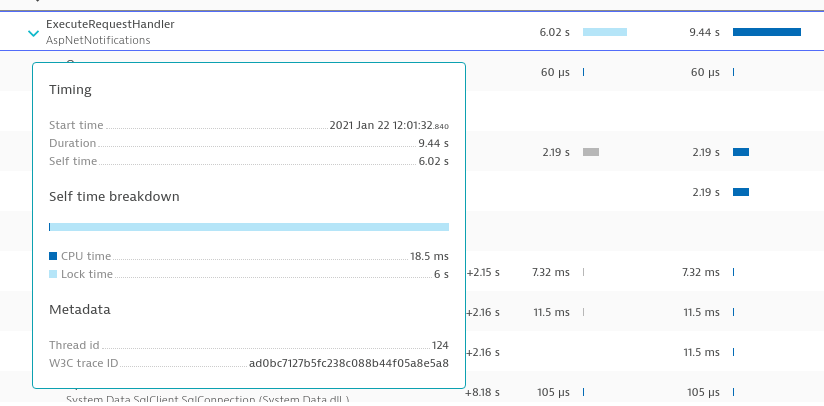
You might have the answer at the code level details.
Options
- Mark as New
- Subscribe to RSS Feed
- Permalink
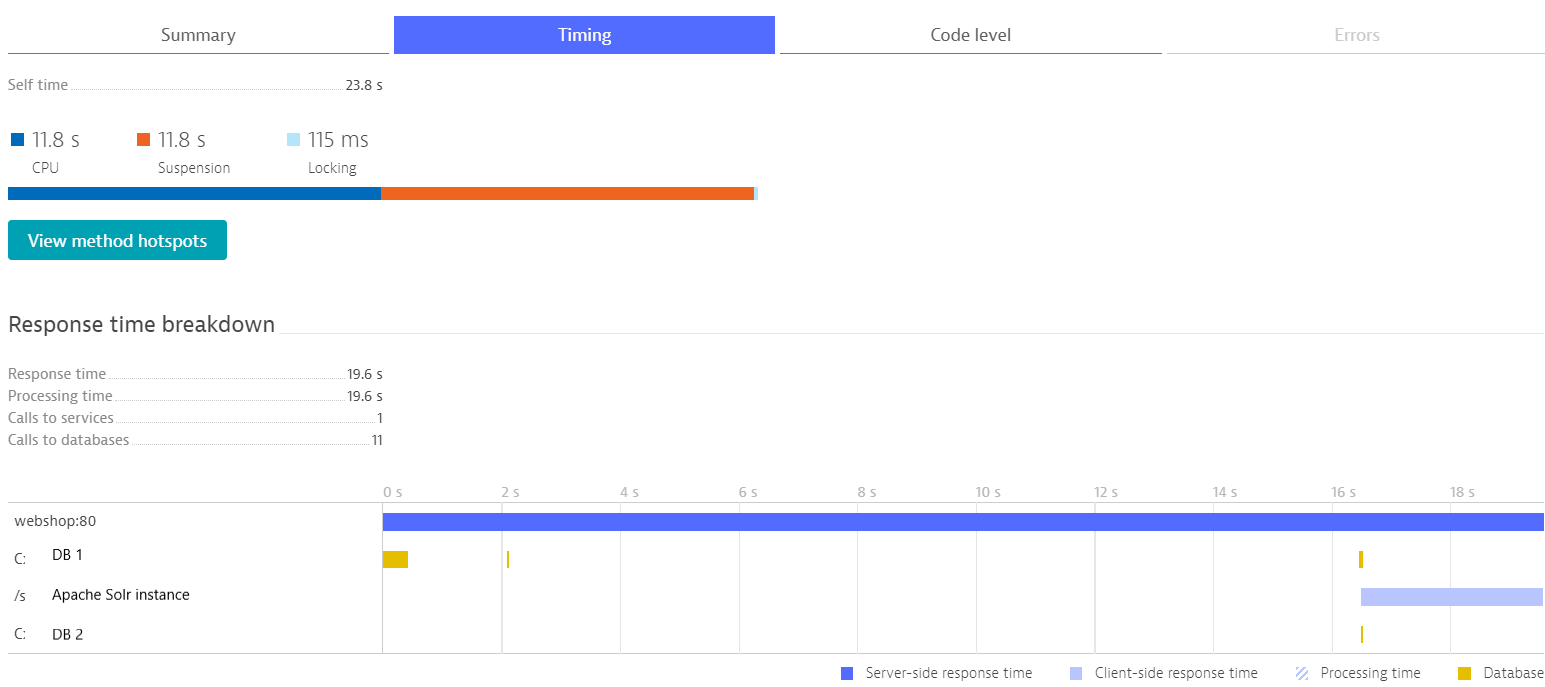
25 Jan 2021 10:09 AM
There are calls to 2 DBs and 1 Apache Solr instance. It seems there are very little locking time from what I see on the Timing tab, but a lot of suspension time. Do you have any idea what the suspension can be caused by, if not DB locking?