- Dynatrace Community
- Dynatrace
- Ask
- Alerting
- Dashboard for MQ "Custom Device" Problem Overview
- Subscribe to RSS Feed
- Mark Topic as New
- Mark Topic as Read
- Pin this Topic for Current User
- Printer Friendly Page
- Mark as New
- Subscribe to RSS Feed
- Permalink
01 Apr 2022
06:06 PM
- last edited on
04 Apr 2022
08:25 AM
by
![]() MaciejNeumann
MaciejNeumann
Hello-
We are using the Dynatrace ActiveGate MQ plugin and I wanted to create a dashboard (using honeycomb tile) to show an overview of all of our MQ Queue managers (custom devices) with the cell to turn red if a current problem exists for that device.
Any ideas how to use the honeycomb to do this?
-Larry
Solved! Go to Solution.
- Mark as New
- Subscribe to RSS Feed
- Permalink
01 Apr 2022 06:44 PM
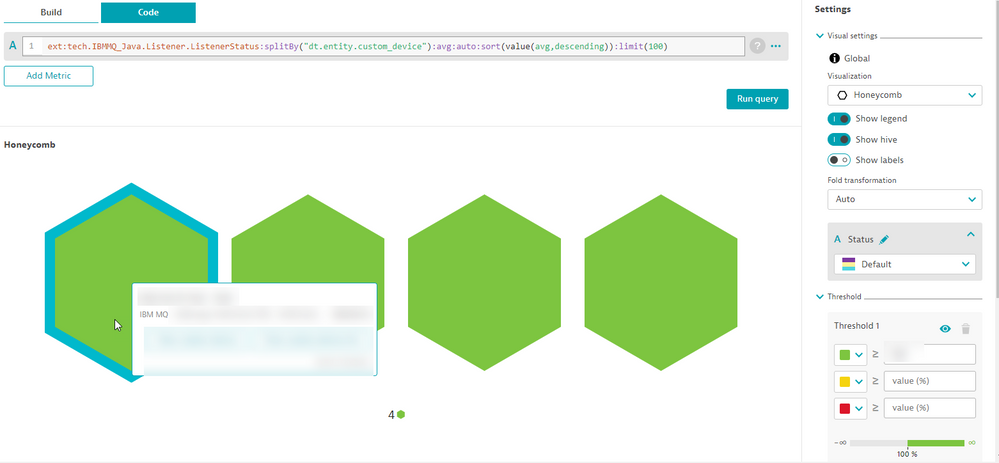
you could use this: ext:tech.IBMMQ_Java.Listener.ListenerStatus:splitBy("dt.entity.custom_device"):avg:auto:sort(value(avg,descending)):limit(100)
And set it to IBMMQ then add in a color threshold schema via the Data Explorer.
- Mark as New
- Subscribe to RSS Feed
- Permalink
01 Apr 2022 07:22 PM
Hi Chad. Thank you, for your response. Yes that is one of the overviews that I want. But, what I was specifically, looking for was if a device encounters any configured problems (i.e. Dead Letter Queue messages, full message queues, etc.).
- Mark as New
- Subscribe to RSS Feed
- Permalink
01 Apr 2022 08:29 PM
I believe this is a good fit for an RFE.
Indeed there is no metric available that shows the overall status of a custom device (any type).
You can see if any custom device is with some open problem, doing the filters on the Problem page. You can use tags to this filter , or Custom device Group (if all into the same) and then pin it to a dashboard, but it will not be so pretty as the Honeycomb widget.

