- Dynatrace Community
- Dynatrace
- Ask
- Alerting
- Re: Metric Events
- Subscribe to RSS Feed
- Mark Topic as New
- Mark Topic as Read
- Pin this Topic for Current User
- Printer Friendly Page
- Mark as New
- Subscribe to RSS Feed
- Permalink
22 Feb 2024
06:01 PM
- last edited on
11 Mar 2024
07:56 AM
by
![]() MaciejNeumann
MaciejNeumann
A problem is not detected if we use metric selector but its reported when we use metric key.
The query used for metric selector works fine as it shows correct data in explorer but just doesn't create the problem event.
This is with apigee extension.
Solved! Go to Solution.
- Labels:
-
alerting
-
metrics
-
problem detection
- Mark as New
- Subscribe to RSS Feed
- Permalink
22 Feb 2024 07:14 PM
Could you provide more details about the configuration settings you are using in this metric event for both?
- Mark as New
- Subscribe to RSS Feed
- Permalink
23 Feb 2024 12:03 PM - edited 23 Feb 2024 12:53 PM
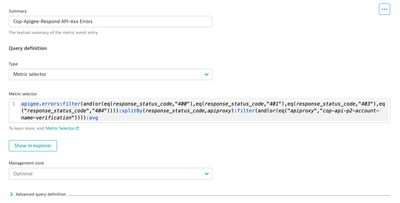
With Metric Selector = No Problem raised
Query works as we get data in graph and data explorer correctly.
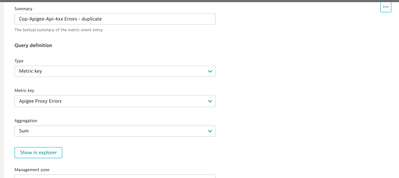
With Metric Key = Problem Raised
This is with APigee Extension
They both show potential alerts but metric selector one does not create a problem
- Mark as New
- Subscribe to RSS Feed
- Permalink
23 Feb 2024 01:57 PM
Are you using fixed thresholds in both?
- Mark as New
- Subscribe to RSS Feed
- Permalink
23 Feb 2024 02:58 PM - edited 23 Feb 2024 03:07 PM
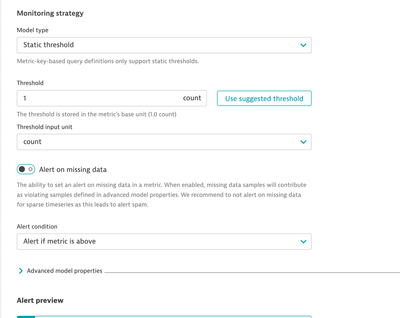
Yep.. Its static something like below, we kept everything same for both the scenarios. If the count of errors is more than 1, want to trigger a custom alert.
It shows that there is potential alert in both cases but problem is not raised if metric selector is used and problem is raised if metric key is used.
- Mark as New
- Subscribe to RSS Feed
- Permalink
26 Feb 2024 12:12 PM - edited 26 Feb 2024 12:15 PM
is there any filter used in metric key definition?
- Mark as New
- Subscribe to RSS Feed
- Permalink
26 Feb 2024 12:19 PM - edited 26 Feb 2024 12:19 PM
Thanks for the reply. No Dimension filter is selected when we use metric key.
- Mark as New
- Subscribe to RSS Feed
- Permalink
26 Feb 2024 12:21 PM
ok, but in selector definition you have 4 filters.
- Mark as New
- Subscribe to RSS Feed
- Permalink
26 Feb 2024 12:28 PM - edited 26 Feb 2024 12:28 PM
Yes.. thats why we want to use selector.
We have 8 apigee apis and by using metric key we get data for all 8 apis which is what we dont want. We want custom alerts for one set of apis which are grouped as request and another set called as response so by using metric selector and filters we want to segregate.
The issue is query used in metric selector works fine in data explorer and shows potential alert but does not raise a Problem. Hope that makes sense..
- Mark as New
- Subscribe to RSS Feed
- Permalink
26 Feb 2024 12:50 PM
i see, but there is also "or" filter for 401-404 return codes in selector one
- Mark as New
- Subscribe to RSS Feed
- Permalink
26 Feb 2024 02:04 PM
Yes we need that as well to filter the set of apis and trigger an alert if status is one of those!
- Mark as New
- Subscribe to RSS Feed
- Permalink
26 Feb 2024 03:46 PM
no issues with advanced model properties? default 3/5/5?
in key definition you seem to sum all 40x return code dimensions and in selector definition you split each 40x code into separate dimension
each of this hints is just guessing, you have to play with settings a bit, b/c it's not always same what seems to be
i suggest you to start playing with some simple selector, that easily can be converted into key definition (f.e. all codes aggregated with sum filtered only per specific apiproxy)
- Mark as New
- Subscribe to RSS Feed
- Permalink
23 Feb 2024 05:01 PM
The Aggregation you are using in selector is avg, while in key is sum.
Did you tried to change this and observe?
- Mark as New
- Subscribe to RSS Feed
- Permalink
23 Feb 2024 05:03 PM
Yep tried with sum and avg in both cases.. 😞 its just the moment we change to metric selector, it just stops detecting problem.
- Mark as New
- Subscribe to RSS Feed
- Permalink
26 Feb 2024 10:38 AM - edited 26 Feb 2024 10:38 AM
We are a bit stuck with this. Are there any restrictions on extensions using metric selectors of any sort?? Not sure where we are going wrong. As it works moment we change to metric key and raises a problem. Thanks for the help. Happy to have a call and show if thats helpful sometime today.
- Mark as New
- Subscribe to RSS Feed
- Permalink
08 Mar 2024 12:46 PM
Hi,
We are currently facing pretty much the same issue. We have a metric extracted from a log, for which we want to set up a custom event once it passes a specific threshold with an advanced model of 1/3/3(1 violating in 3 minutes windows with 3 dealerting to close). The metric selector is very simple:
log.fallbackbigdata:splitBy():sum:sort(value(sum,descending))
And in the preview we see the data and the potential alert, yet we don't actually get a problem raised.


