- Dynatrace Community
- Dynatrace
- Ask
- Container platforms
- Re: How to get traces from k3s cluster using dynatrace operator
- Subscribe to RSS Feed
- Mark Topic as New
- Mark Topic as Read
- Pin this Topic for Current User
- Printer Friendly Page
Get traces from K3s cluster using the Dynatrace operator
- Mark as New
- Subscribe to RSS Feed
- Permalink
07 Jun 2023
02:16 PM
- last edited on
13 Jun 2023
04:28 PM
by
![]() Ana_Kuzmenchuk
Ana_Kuzmenchuk
I have installed Dynatrace operator in my K3s cluster. I can see metrics in Dynatrace but i can't see any traces. I have so many services running in my K3s cluster but I can't see any service under Service section of Dynatrace. Please share any link to get metrics, logs and traces of K3s cluster, workloads, host metrics, logs, traces.
- Labels:
-
kubernetes
- Mark as New
- Subscribe to RSS Feed
- Permalink
07 Jun 2023 02:44 PM
Hi @chandra-zs,
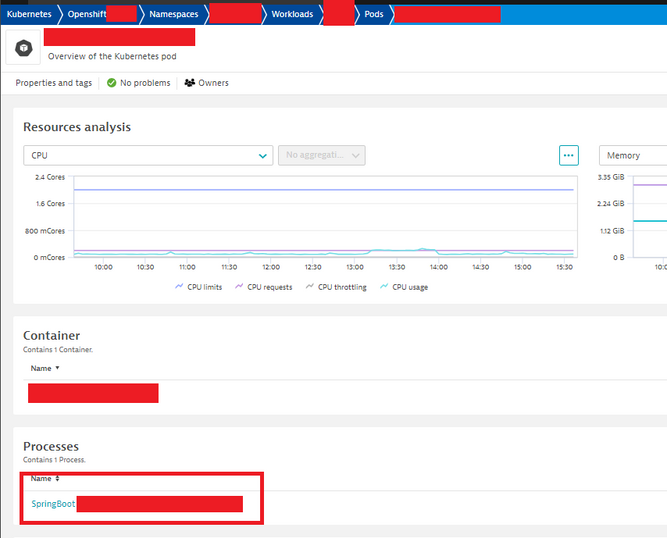
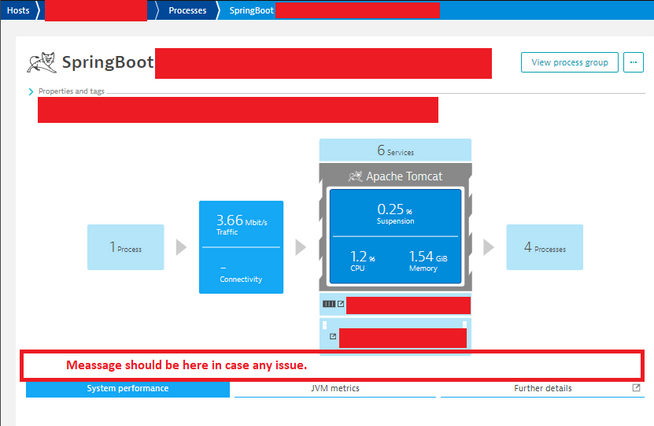
What do you see at your process? Do you have any message on the process view?
Step1 click on your process:
Step2 check the possible message at the process:
I hope it helps.
Best regards,
Mizső
- Mark as New
- Subscribe to RSS Feed
- Permalink
08 Jun 2023 05:52 AM
Hi @Mizső
I can't see any containers and process under my pod in kubernetes cluster.
- Mark as New
- Subscribe to RSS Feed
- Permalink
08 Jun 2023 05:54 AM
Hi @Mizső
But in hosts under process section i can see message like Activation of deep monitoring was unsuccessful. Cloud pls help me how to resolve this.
- Mark as New
- Subscribe to RSS Feed
- Permalink
08 Jun 2023 06:15 AM - edited 08 Jun 2023 06:26 AM
Hi @chandra-zs,
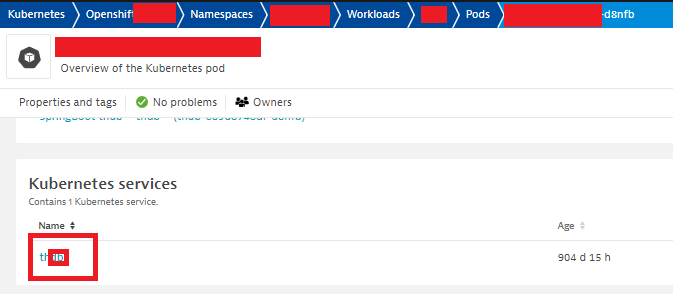
What can be found above the Kubernetes-services? Nothing?
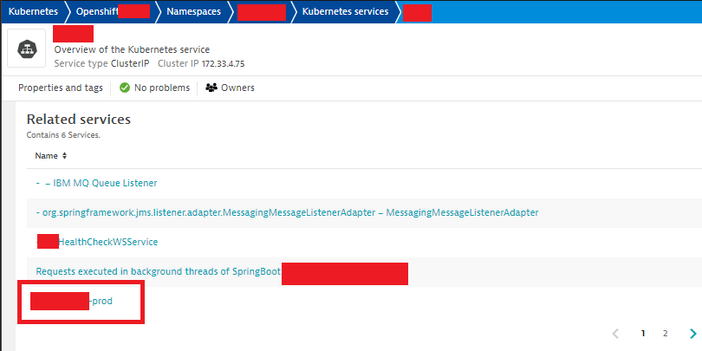
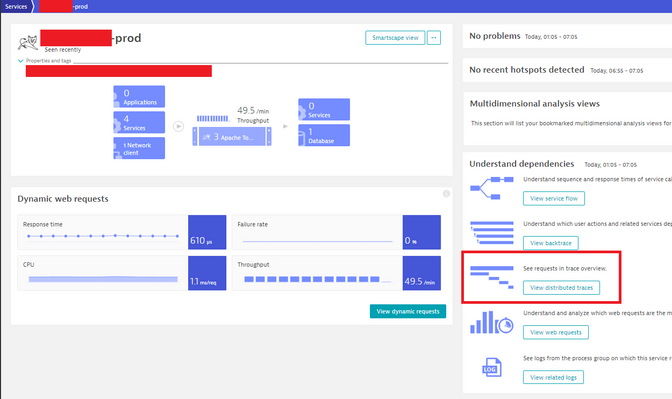
Could you please click-on the test app service and you should find a related services section. In this section you can chose a service and then you can analyize the distributed traces:
Step1: click on the Kubernetes service:
Step2: Click on one related service.
Step3: You can reach the distributed traces.
Best regards,
Mizső
- Mark as New
- Subscribe to RSS Feed
- Permalink
08 Jun 2023 06:24 AM
Hi @Mizső,
I can't see any related services under service. Below i am attaching screenshot. In hosts section under process it showing Activation of deep monitoring was unsuccessful. TIA
- Mark as New
- Subscribe to RSS Feed
- Permalink
08 Jun 2023 11:15 AM
Hi @Mizső
I can see different messages under system performance for different languages.
- Mark as New
- Subscribe to RSS Feed
- Permalink
08 Jun 2023 06:11 PM
Hi @chandra-zs
Your node.js version is not supported however it is a LTS vesrion.
Here is the supported node.js versions:
Regarding GO you can follow the link in the message and enable the Go static injection.
Best regards,
Mizső
- Mark as New
- Subscribe to RSS Feed
- Permalink
08 Jun 2023 06:22 PM
Hi @Mizső
I have installed supported nodejs but i can't see any traces. When coming to Go application i tried to enable go static monitoring in the settings but it is saying oneagent 1.23+ version is required. My oneagent version is 1.26+. TIA
- Mark as New
- Subscribe to RSS Feed
- Permalink
08 Jun 2023 06:45 PM
Hello @Mizső
I have installed dynatrace in classic full stack mode using crd's. The oneagent will apply auto instrumentation right. Why i am not able to see any traces under distributed traces. Please doc or steps to get traces, metrics, logs from the host and k8s cluster workloads. TIA
- Mark as New
- Subscribe to RSS Feed
- Permalink
09 Jun 2023 06:00 AM
Hi @chandra-zs,
I suggest to open a support case and share more information with the support team.
Best regards,
Mizső
- Mark as New
- Subscribe to RSS Feed
- Permalink
09 Jun 2023 06:00 AM
I have installed dynatrace operator in my k8s cluster. I can see metrics, logs but i can't see any traces in dynatrace. As per documentation dynatrace operator will install oneagent and oneagent will apply auto instrumentation to collect traces. But why i am not able see any traces. Cloud some one help me.
- Mark as New
- Subscribe to RSS Feed
- Permalink
13 Jun 2023 04:26 PM
Hi @chandra-zs, were you able to solve the issue in the meantime? The Community would really appreciate if you shared the solution / what you have tried / what you've heard back from the Support 🙂 Thanks!
