- Dynatrace Community
- Dynatrace
- Ask
- Container platforms
- Kubernetes dynatrace operator one agent cpu requests and limits against cpu throttling
- Subscribe to RSS Feed
- Mark Topic as New
- Mark Topic as Read
- Pin this Topic for Current User
- Printer Friendly Page
- Mark as New
- Subscribe to RSS Feed
- Permalink
26 Aug 2022
02:17 PM
- last edited on
29 Aug 2022
08:22 AM
by
![]() MaciejNeumann
MaciejNeumann
Hi Folks,
In the Dynatrace operator documentation I have not found any recommondation or quide line for the one agent cpu requests and limits setting. I have already read a lot of forums about the kubernetes requests and limits best practises and the missunderstanding around the limits. CPU limits and aggressive throttling in Kubernetes | by Fayiz Musthafa | Omio Engineering | Medium
We have a relatively small test (acceptance environment) kubernetes cluster with 16 nodes and we have instrumented only 6 worker nodes with oneagent. The cpu requests and limites have been sligthly increased in the classicfullstack.yaml:
requests: 100m - > 200m
limits: 300m -> 500m
In spite of the change on the initial cpu requests and limits values the oneagent pods cpu throttling countiounsly (between 300 mCores - 900 mCores). What would be the ideal values of the requests and limits? Do you have any idea?
Environment information: openshift 4.10, dynatrace operator 0.8.1, pod count is between 50 - 60 / worker node.
Thanks in advance.
Br, Mizső
Solved! Go to Solution.
- Labels:
-
kubernetes
-
openshift
- Mark as New
- Subscribe to RSS Feed
- Permalink
26 Aug 2022 02:56 PM
As per samples form https://github.com/Dynatrace/dynatrace-operator/tree/v0.8.1/assets/samples the proposed values are:
      # oneAgentResources:
      #   requests:
      #     cpu: 100m
      #     memory: 512Mi
      #   limits:
      #     cpu: 300m
      #     memory: 1.5Gi
Regards
- Mark as New
- Subscribe to RSS Feed
- Permalink
29 Aug 2022 08:07 AM
Hi dannemca,
This was the first try with the original / proposed values but the cpu trhottling was higher compare with the new values. That is why we increased the proposed values for requests 100 to 200 and limits 300 to 500 but we still observed cpu throttling. I hoped someone has a real user experience how can we define these values and I could avoid the step by step test of the value changes.
Br, Mizső
- Mark as New
- Subscribe to RSS Feed
- Permalink
02 Sep 2022 08:37 PM
Hi Folks,
Any hints regarding this topic?
Thanks in advance.
Br, Mizső
- Mark as New
- Subscribe to RSS Feed
- Permalink
06 Sep 2022 12:39 AM
Hi Mizső,
Just like memory demand variance (see: https://www.dynatrace.com/support/help/shortlink/id-oneagent-code-module-memory-requirements), the OneAgent CPU usage can be highly variable based on the monitored environment.
The sample that @dannemca has linked is a good place to start by un-commenting those default settings, so they become active.
I usually have the CPU limit removed for OneAgent, since I've seen busy environments where it frequently wants up to a whole core. Then I monitor to see it's usage and set an appropriate limit as you don't want too much CPU throttling.
Other environments are quiet and use much less than sample settings.
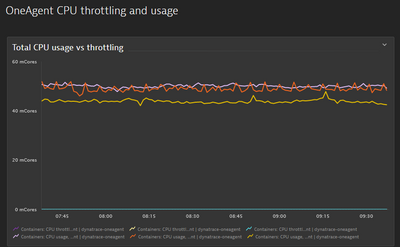
An example dashboard tile that could help you to monitor:
{
  "metadata": {
    "configurationVersions": [
      6
    ],
    "clusterVersion": "1.249.165.20220902-174254"
  },
  "dashboardMetadata": {
    "name": "OneAgent CPU throttling and usage",
    "shared": false,
    "owner": "",
    "tags": [
      "Self-monitoring"
    ],
    "hasConsistentColors": false
  },
  "tiles": [
    {
      "name": "Total CPU usage vs throttling",
      "tileType": "DATA_EXPLORER",
      "configured": true,
      "bounds": {
        "top": 0,
        "left": 0,
        "width": 836,
        "height": 456
      },
      "tileFilter": {},
      "customName": "Total CPU usage vs throttling",
      "queries": [
        {
          "id": "A",
          "timeAggregation": "DEFAULT",
          "splitBy": [],
          "metricSelector": "builtin:containers.cpu.throttledMilliCores:avg:filter(and(eq(Container,dynatrace-oneagent))):splitBy(\"dt.entity.container_group_instance\",Container):sum:auto:sort(value(sum,descending)):limit(10)",
          "enabled": true
        },
        {
          "id": "B",
          "timeAggregation": "DEFAULT",
          "splitBy": [],
          "metricSelector": "builtin:containers.cpu.usageMilliCores:avg:filter(and(eq(Container,dynatrace-oneagent))):splitBy(\"dt.entity.container_group_instance\",Container):sum:auto:sort(value(sum,descending)):limit(10)",
          "enabled": true
        }
      ],
      "visualConfig": {
        "type": "GRAPH_CHART",
        "global": {
          "hideLegend": false
        },
        "rules": [
          {
            "matcher": "A:",
            "properties": {
              "color": "DEFAULT"
            },
            "seriesOverrides": []
          },
          {
            "matcher": "B:",
            "properties": {
              "color": "DEFAULT"
            },
            "seriesOverrides": []
          }
        ],
        "axes": {
          "xAxis": {
            "visible": true
          },
          "yAxes": [
            {
              "visible": true,
              "min": "AUTO",
              "max": "AUTO",
              "position": "LEFT",
              "queryIds": [
                "A",
                "B"
              ],
              "defaultAxis": true
            }
          ]
        },
        "heatmapSettings": {
          "yAxis": "VALUE"
        },
        "thresholds": [
          {
            "axisTarget": "LEFT",
            "rules": [
              {
                "color": "#7dc540"
              },
              {
                "color": "#f5d30f"
              },
              {
                "color": "#dc172a"
              }
            ],
            "queryId": "",
            "visible": true
          }
        ],
        "tableSettings": {
          "isThresholdBackgroundAppliedToCell": false
        },
        "graphChartSettings": {
          "connectNulls": false
        },
        "honeycombSettings": {
          "showHive": true,
          "showLegend": true,
          "showLabels": false
        }
      },
      "queriesSettings": {
        "resolution": ""
      },
      "metricExpressions": [
        "resolution=null&(builtin:containers.cpu.throttledMilliCores:avg:filter(and(eq(Container,dynatrace-oneagent))):splitBy(\"dt.entity.container_group_instance\",Container):sum:auto:sort(value(sum,descending)):limit(10)):limit(100):names,(builtin:containers.cpu.usageMilliCores:avg:filter(and(eq(Container,dynatrace-oneagent))):splitBy(\"dt.entity.container_group_instance\",Container):sum:auto:sort(value(sum,descending)):limit(10)):limit(100):names"
      ]
    }
  ]
}
Andrew M.
- Mark as New
- Subscribe to RSS Feed
- Permalink
06 Sep 2022 08:15 AM
Hi Andrew,
Thank you very much for your response. I have already un-commented the resource parameters and modified it but cpu throttling is still with us. Unfortunately at the client limit less configuration is not allowed in Production. In the test OP cluster I am going to try your apporche and cpu limits will be removed. Thanks for the dashboard.
Have a nince day.
Br, Mizső
- Mark as New
- Subscribe to RSS Feed
- Permalink
06 Sep 2022 09:05 AM
You are welcome @Mizső
Andrew M.
- Mark as New
- Subscribe to RSS Feed
- Permalink
06 Sep 2022 08:59 AM
Hi Andrew,
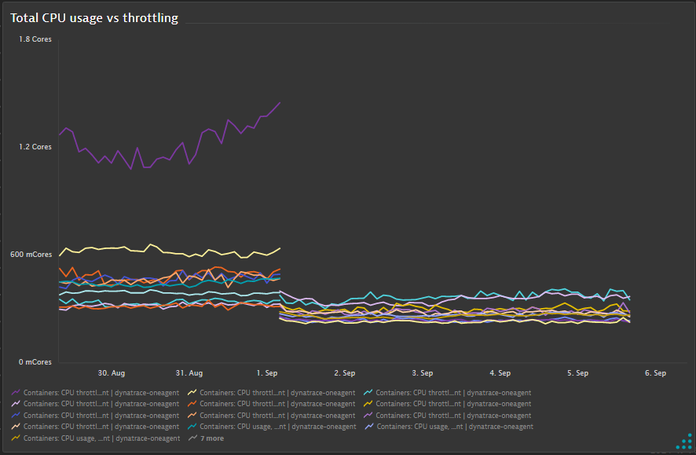
The dashboard is very useful perviously I used only the Kubernetes individual one-agent pods views to check the cpu throttling. After the current managed release update the situation is a little bit consolidated, there is still cpu throttling but not so huge. You can see the managed upgrade time in the dashboard. I am going to check the actual cpu throttling of on-agent pod with this dashboard:
So this is the current status, it is much better the before (acual setting is requests 200m - limits 500m)
Thanks for your support.
Best regards,
János
- Mark as New
- Subscribe to RSS Feed
- Permalink
06 Sep 2022 09:06 AM
I am glad to see it has been useful for you. Thank you
Andrew M.


