- Dynatrace Community
- Dynatrace
- Ask
- DQL
- Grail Aggregation Function Percentiles
- Subscribe to RSS Feed
- Mark Topic as New
- Mark Topic as Read
- Pin this Topic for Current User
- Printer Friendly Page
Grail Aggregation Function Percentiles
- Mark as New
- Subscribe to RSS Feed
- Permalink
15 Feb 2024
05:50 PM
- last edited on
01 Mar 2024
08:23 AM
by
![]() MaciejNeumann
MaciejNeumann
- Mark as New
- Subscribe to RSS Feed
- Permalink
21 Feb 2024 12:10 AM
Hello,
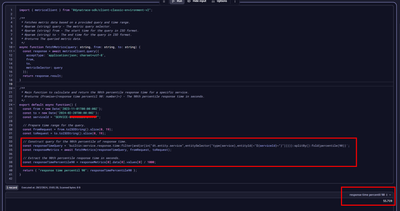
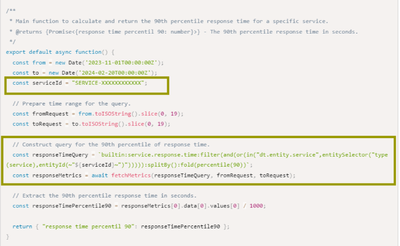
I understand that, as of now, direct support for retrieving the 90th percentile timeseries data might not be available. However, I remember plans are underway to introduce this functionality. In the meantime, you can use JavaScript along with APIs to query metrics, specifically targeting the 90th percentile. Below, I've shared my optimized JavaScript code for efficiently calculating the 90th percentile response time.
import { metricsClient } from "@dynatrace-sdk/client-classic-environment-v2";

/**
 * Fetches metric data based on a provided query and time range.
 * @param {string} query - The metric query selector.
 * @param {string} from - The start time for the query in ISO format.
 * @param {string} to - The end time for the query in ISO format.
 * @returns The queried metric data.
 */
async function fetchMetrics(query: string, from: string, to: string) {
  const response = await metricsClient.query({
    acceptType: 'application/json; charset=utf-8',
    from,
    to,
    metricSelector: query
  });
  return response.result;
}

/**
 * Main function to calculate and return the 90th percentile response time for a specific service.
 * @returns {Promise<{response time percentil 90: number}>} - The 90th percentile response time in seconds.
 */
export default async function() {
  const from = new Date('2023-11-01T00:00:00Z');
  const to = new Date('2024-02-20T00:00:00Z');
  const serviceId = "SERVICE-XXXXXXXXXXXX";

  // Prepare time range for the query.
  const fromRequest = from.toISOString().slice(0, 19);
  const toRequest = to.toISOString().slice(0, 19);

  // Construct query for the 90th percentile of response time.
  const responseTimeQuery = `builtin:service.response.time:filter(and(or(in("dt.entity.service",entitySelector("type(service),entityId(~"${serviceId}~")"))))):splitBy():fold(percentile(90))`;
  const responseMetrics = await fetchMetrics(responseTimeQuery, fromRequest, toRequest);

  // Extract the 90th percentile response time in seconds.
  const responseTimePercentile90 = responseMetrics[0].data[0].values[0] / 1000;

  return { "response time percentil 90": responseTimePercentile90 };
}
- Mark as New
- Subscribe to RSS Feed
- Permalink
21 Feb 2024 08:47 AM
Percentiles are important for any customer or user, because averages really only skim the surface of what is happening. The problem with this solution(not just becaause its javascript, not everyone knows it) is that it is service-based... I need something that does the same for metrics obtained from logs... to be specific, timeseries data parsed out from fetched log data. Or are you saying, no need to cut metrics, use this approach using raw log data?
if I understand correctly, this code simply does an old school data fetch from dynatrace and (potentially) displays it. It doesnt actually implement a percentile based data-crunch.
- Mark as New
- Subscribe to RSS Feed
- Permalink
29 Feb 2024 09:37 AM - edited 11 Mar 2024 10:54 PM
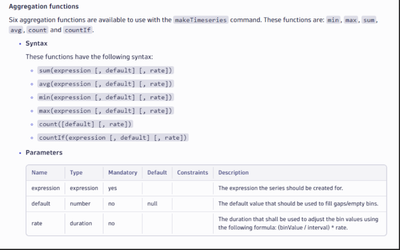
I too am in need of `percentile` in `makeTimeseries` command, and after reading https://docs.dynatrace.com/docs/platform/davis-ai/basics/percentiles-for-analyzing-performance I was surprised there weren't more aggregation functions available! https://docs.dynatrace.com/docs/platform/grail/dynatrace-query-language/functions/aggregation-functi...
Can we vote somewhere to request this? Is it a technical limitation there aren't more aggregation commands available in `makeTimeseries`?
It would also be good to label this with "aggregation", "makeTimeseries", etc.
Edit: in October 2023 Fabrice said "we're going to have percentile very soon", WRT to the grail timeseries command - https://community.dynatrace.com/t5/Videos/A-Practical-Guide-to-DQL-for-Metrics/td-p/225776
- Mark as New
- Subscribe to RSS Feed
- Permalink
01 Mar 2024 01:05 AM - edited 01 Mar 2024 09:56 PM
I'm using this approximation, though the accuracy is sensitive to the interval in the bin() call and that calculated by the makeTimeseries() call. You also seem to need the field as a number, not a string.
fetch logs
| summarize _90 = percentile(field, 90), by: { timestamp = bin(timestamp, 1m) }
| makeTimeseries avg(_90)
I'm not sure how to get the time span from the dashboard into a query so if you use this in a dash, you'll need to remember that the accuracy might be quite poor depending on the intervals.
- Mark as New
- Subscribe to RSS Feed
- Permalink
15 Mar 2024 04:30 PM
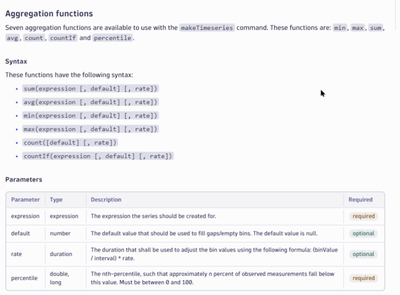
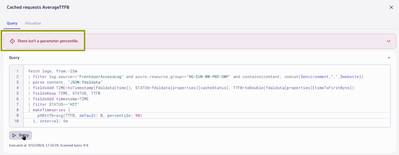
Today we have noticed that the documentation page was updated (this is cool, but annoying as we dont know what updated). In this case we can see percentiles have appeared:
However, we tried this in our env....we hit a bug
- Mark as New
- Subscribe to RSS Feed
- Permalink
16 Mar 2024 08:50 AM
This is promising!
I feel like it's equal chance a bug in the docs or a bug in the code. The docs first say that percentile() is available as an aggregation function, but the immediately following bullet list doesn't include it. The next portion says that percentile is a parameter, but doesn't say to which function (it's not listed in any of the function synopsis).
This leads me to think the percentile parameter is only available on the percentile function, but I haven't tried yet.
Thanks for the heads up, I'll give it a go shortly!
- Mark as New
- Subscribe to RSS Feed
- Permalink
16 Apr 2024 09:17 AM
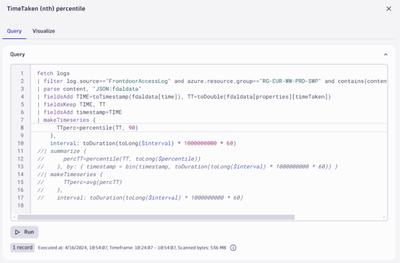
Yesterday i used the percentiles and its working. Please check now.
- Mark as New
- Subscribe to RSS Feed
- Permalink
16 Apr 2024 09:57 AM
Great news, just tried and its working for me now too!
