- Dynatrace Community
- Dynatrace
- Ask
- Dashboarding
- Best Dashboarding Practices for Generic Type Metrics
- Subscribe to RSS Feed
- Mark Topic as New
- Mark Topic as Read
- Pin this Topic for Current User
- Printer Friendly Page
Best Dashboarding Practices for Generic Type Metrics
- Mark as New
- Subscribe to RSS Feed
- Permalink
01 Aug 2023
08:05 PM
- last edited on
14 Aug 2023
10:11 AM
by
![]() MaciejNeumann
MaciejNeumann
Team,
I've successfully configured an application to use Micrometer to send metrics to the Dynatrace tenant. These metrics are received by Dynatrace and fall under the classification of "generic types". This means that in the data explorer these metrics display a description rather than the metric-prefix itself.
I am wondering what the best tile types are for each of the following metrics. At the moment I am currently just creating single values and line charts. Any advice is appreciated!
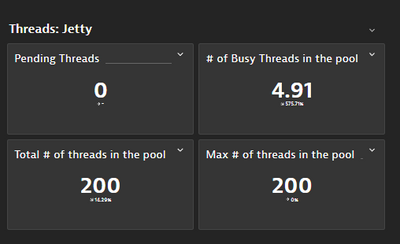
# Threads
ext:jetty.threads.config.min
ext:jetty.threads.config.max
ext:jetty.threads.busy
ext:jetty.threads.idle
ext:jetty.threads.current
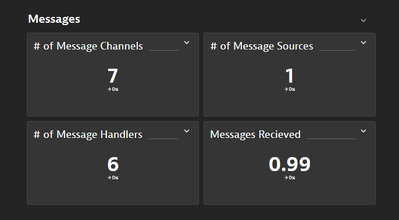
# Messages
ext:spring.integration.channels
ext:spring.integration.handlers
ext:spring.integration.sources
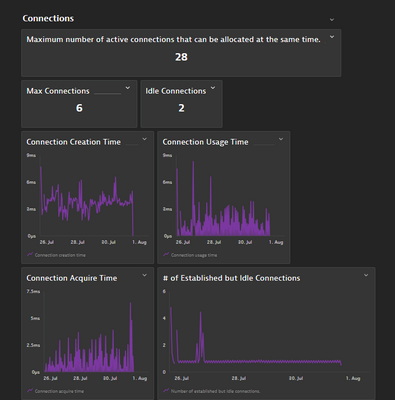
# Connections
ext:hikaricp.connections - Total Connections
ext:hikaricp.connections.timeout - Connection timeout total count
ext:hikaricp.connections.acquire.avg - Connection Acquire Time
ext:hikaricp.connections.acquire.count - Connection Acquire Time
ext:hikaricp.connections.acquire.sum - Connection Acquire Time
ext:hikaricp.connections.acquire.max - Connection Acquire Time
ext:hikaricp.connections.creation.avg - Connection Creation Time
ext:hikaricp.connections.creation.count - Connection Creation Time
ext:hikaricp.connections.creation.sum - Connection Creation Time
ext:hikaricp.connections.creation.max - Connection Creation Time
ext:hikaricp.connections.idle - Idle Connections
ext:hikaricp.connections.max - Max Connections
ext:hikaricp.connections.min - Min Connections
ext:hikaricp.connections.active - Active Connections
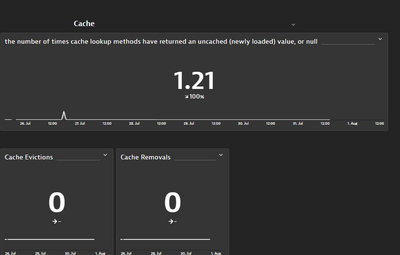
# Cache
ext:cache.gets - the number of times cache lookup methods have returned an uncached (newly loaded) value, or null
ext:cache.puts - The number of entries added to the cache
ext:cache.removals - Cache Removals
ext:cache.evictions - Cache Evictions
Messages - Spring metrics
Threads - Jetty
- Labels:
-
metrics
- Mark as New
- Subscribe to RSS Feed
- Permalink
17 Aug 2023 06:35 PM
It really depends on your organizations needs for monitoring of those metrics. You can further enhance your dashboard with threshold colors and backgrounds. a sample of what you can do is documented here: https://community.dynatrace.com/t5/Dynatrace-tips/PRO-TIP-New-Hex-Code-Color-Picker/m-p/201388#M639


