- Dynatrace Community
- Dynatrace
- Ask
- Dashboarding
- Panel that displays pods with failure rate more than 50%
- Subscribe to RSS Feed
- Mark Topic as New
- Mark Topic as Read
- Pin this Topic for Current User
- Printer Friendly Page
Panel that displays pods with failure rate more than 50%
- Mark as New
- Subscribe to RSS Feed
- Permalink
23 Jan 2024
05:18 AM
- last edited on
24 Jan 2024
11:32 AM
by
![]() Michal_Gebacki
Michal_Gebacki
- i am trying to make a panel to observe the pods which are having failure rate high.
i can able to filter on pod_status but not on the pods failure rate.
Can anyone suggest me what should be used as filter condition to achieve this.
- Labels:
-
dashboards
-
kubernetes
- Mark as New
- Subscribe to RSS Feed
- Permalink
27 Mar 2024 06:35 PM
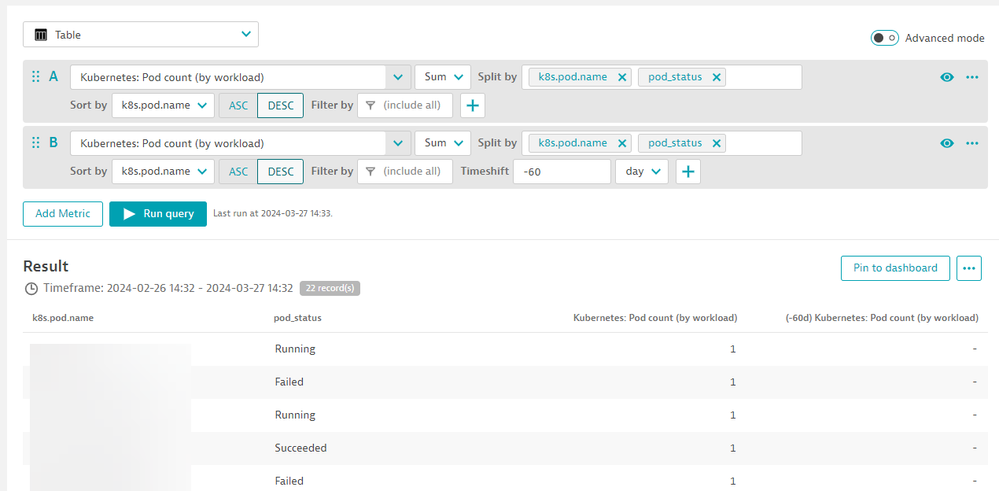
I would do something like this:
You can further refine it as needed
- Mark as New
- Subscribe to RSS Feed
- Permalink
30 Apr 2024 04:55 AM
Hi @srikanthd
I think that exist a confused. The pods don't have a metric like a failure rate.
The metric of "failure rate" it's in the service. Pods and Services have a relation, but both are not the same.
In One Pod, you can find different process, and that process can give you a traffic of services.
Pods have a information like : Status, Age, IP address, containers, Total container restarts.
Pods have a metrics like : CPU, Memory .
Containers in Pod have metrics like: CPU (usage, shares, % of limit), Memory (cache, physical total, % of limit), etc.
Services have metrics like : response time, failure rate, CPU, throutput
I Recommend you identify the services in your process group, and then use the metric : builtin:service.errors.server.rate , for the failure rate .
I hope it's helpfull 💪

