- Dynatrace Community
- Dynatrace
- Ask
- Dashboarding
- Response time - Behavior Partition function
- Subscribe to RSS Feed
- Mark Topic as New
- Mark Topic as Read
- Pin this Topic for Current User
- Printer Friendly Page
Response time - Behavior Partition function
- Mark as New
- Subscribe to RSS Feed
- Permalink
13 Feb 2024 10:38 AM
Hi Community,
I'm trying to plot a distribution of response times for a user action to display in a dashboard (Classic for now).
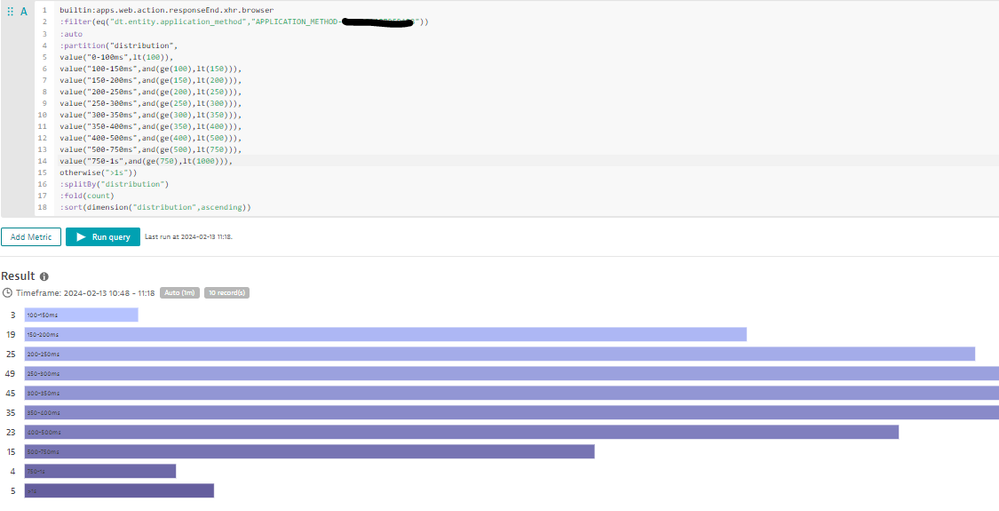
I'm using the partition function to create a dimension with a distribution of response times:
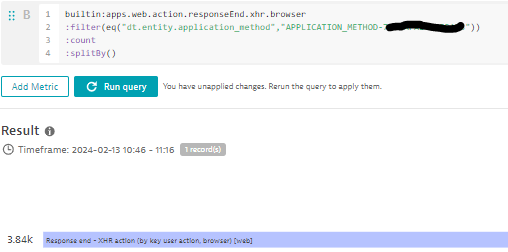
However, when I add up all the partition results, I don't get the "Count" result for the action:
I've read a lot of documentation, tried several ways and even used Dynatrace's Professional Services (ACE)... But I still don't have any reliable answers 😞
The community remains my last chance to refine the query or at least understand the result 🙏
-Do you know why I can't get the total "count" of the action?
-Do you know what the values shown in my breakdown actually correspond to?
Thank you for your help 😀
- Mark as New
- Subscribe to RSS Feed
- Permalink
13 Feb 2024 12:50 PM - edited 13 Feb 2024 01:02 PM
your partition distribution does not count each xhr action. instead it counts response time buckets.
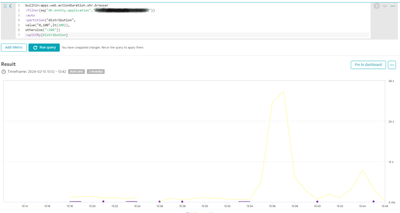
here is what is counted - number of bucket hits per timeframe, i have 2 buckets in my example:
when you remove fold(count), you will see exact points when each bucket was hit during selected timeframe (cyan is <200ms bucket, yellow is rest bucket):
- Mark as New
- Subscribe to RSS Feed
- Permalink
13 Feb 2024 01:53 PM
@rastislav_danis ,
Each of my recorded actions (3.84k actions) has a response time that should fit into a bucket.
So theoretically, if I add up all the hits from all the buckets, shouldn't I get the total number of actions?
- Mark as New
- Subscribe to RSS Feed
- Permalink
13 Feb 2024 01:59 PM - edited 13 Feb 2024 02:00 PM
but in fold(count) you just count buckets, not actions. f.e in my example, lower latency bucket (<200ms) was hit 9 times so count of bucket <200 (mistakenly named "0,100";) was 9, but in reality number of xhr actions with response <200ms was much higher (several tens of actions in that timeframe)
- Mark as New
- Subscribe to RSS Feed
- Permalink
13 Feb 2024 02:16 PM
if you create partitions based on value you will lost number of items in partition buckets
- Mark as New
- Subscribe to RSS Feed
- Permalink
13 Feb 2024 02:29 PM
OK.
So how should I phrase my query so that I can count the number of shares in each bucket?
I'm sorry, but I'm having a lot of trouble really understanding how the partition works.
- Mark as New
- Subscribe to RSS Feed
- Permalink
13 Feb 2024 03:07 PM
i'm afraid that partition is not right friend for your task 😉 and i'm also afraid this is not possible with pure metrics operations, because you have decoupled response times from counts and you cannot filter count metric based on reponse or otherwise (filter response metric based on counts).
I think only USQL will help you with this
- Mark as New
- Subscribe to RSS Feed
- Permalink
13 Feb 2024 03:19 PM - edited 13 Feb 2024 03:21 PM
for example:
- Mark as New
- Subscribe to RSS Feed
- Permalink
13 Feb 2024 04:09 PM
Thanks !
The result looks much better 😀
The problem is that it's not very readable because I can't graph it properly as a histogram or "Top list" 😭


