- Dynatrace Community
- Dynatrace
- Ask
- Dashboarding
- Re: Use the available metric to monitor a database statement and add to dashboard
- Subscribe to RSS Feed
- Mark Topic as New
- Mark Topic as Read
- Pin this Topic for Current User
- Printer Friendly Page
Use the available metric to monitor a database statement and add to dashboard
- Mark as New
- Subscribe to RSS Feed
- Permalink
25 May 2023
06:05 AM
- last edited on
25 May 2023
07:53 AM
by
![]() MaciejNeumann
MaciejNeumann
Hi Team,
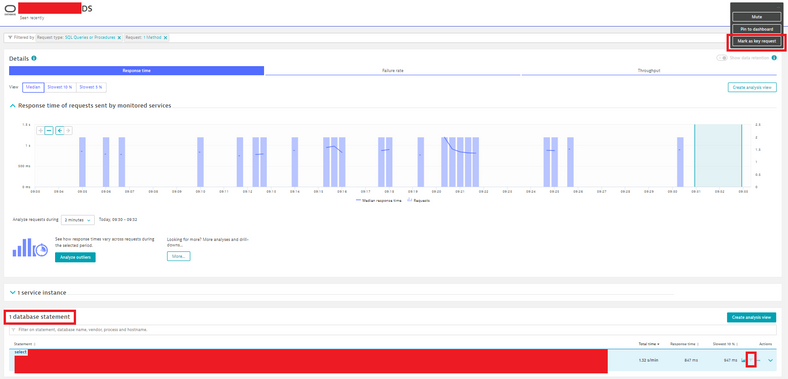
We would like to get the request count of a specific database statement (with or without splitting database) from the data explorer so that we can monitor this in the dashboard.
I tried passing the query as "dt.entity.service_method",entitySelector("type(service_method),entityName.in(~"MY QUERY~")" in the data explorer but was of no luck. Can you please guide me on how this can be achieved or is it even possible to monitor the metrics of a particular database statement in dynatrace?
Regards,
Greeshma
- Mark as New
- Subscribe to RSS Feed
- Permalink
25 May 2023 08:01 AM
Yes, I tried builtin:service.keyRequest.count.total metric as well as other metrics in which I can filter using the request name.
data explorer provides results when the request name is a web request but not for a sql query
Regards,
Greeshma

