- Dynatrace Community
- Dynatrace
- Ask
- Dashboarding
- kubernetes dashboard not loading
- Subscribe to RSS Feed
- Mark Topic as New
- Mark Topic as Read
- Pin this Topic for Current User
- Printer Friendly Page
- Mark as New
- Subscribe to RSS Feed
- Permalink
09 Nov 2023 05:17 PM
I have started my trial and got my AWS EKS cluster connected to my Dynatrace envrionment.
Next, I tried to load one of the JSON dashobards from Andy's Github post:
https://github.com/dynatrace-perfclinics/dynatrace-getting-started/tree/main
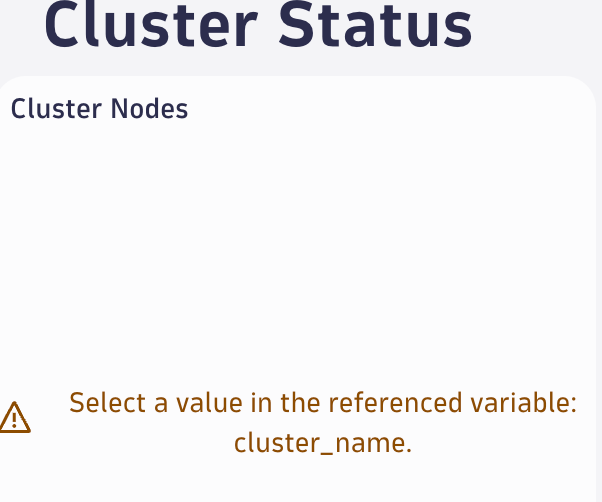
Specifically I am trying to load the "Kubernetes Cluster Overview" dashboard. When I load the JSON file, the dashboard is coming up but with all tiles erroring out:
Can anyone help figure out why this dashboard doesn't load for me?
Solved! Go to Solution.
- Labels:
-
dashboards
-
kubernetes
- Mark as New
- Subscribe to RSS Feed
- Permalink
09 Nov 2023 10:39 PM
Hi @gust_henk,
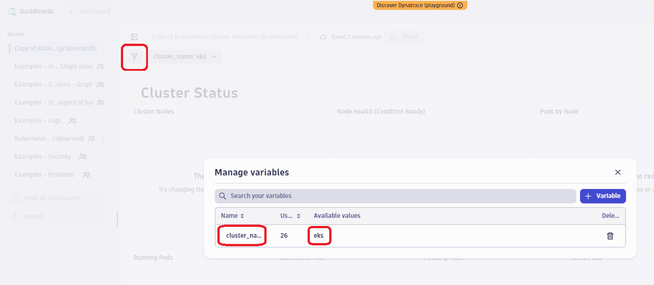
I made a copy in the Playgorund about Andi dashboard in order to be able edit it.
As I see Andi used a variable for the cluster name, so you should see your cluster name among the values:
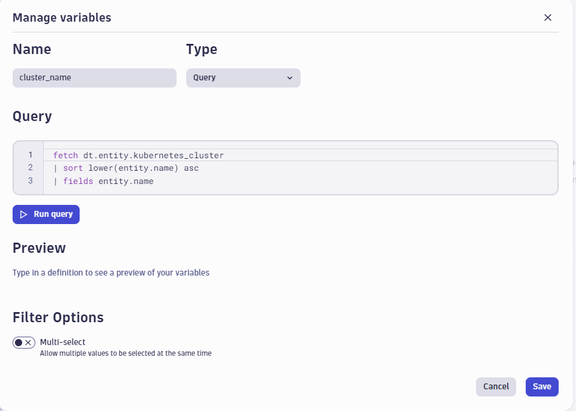
Click on the cluster_name under Name, so this is the query behind it, run the query, do you have a result?:
Extra question: Have you connected to the local or public endpoint of the cluster?
I hope it helps.
Best regards,
Mizső
- Mark as New
- Subscribe to RSS Feed
- Permalink
10 Nov 2023 07:43 AM
Exactly, you still need to configure the connection as @Mizső wrote. I checked with me on the environment and it works.
- Mark as New
- Subscribe to RSS Feed
- Permalink
10 Nov 2023 07:18 PM
I also wanted to point out that when I open the query in my version of Andy's dashboard (latest clone from github), my query is different from the one show in the screen shot above:
timeseries sum(dt.kubernetes.nodes), by: {k8s.cluster.name}, interval: 1d
| fields k8s.cluster.name
- Mark as New
- Subscribe to RSS Feed
- Permalink
10 Nov 2023 03:07 PM
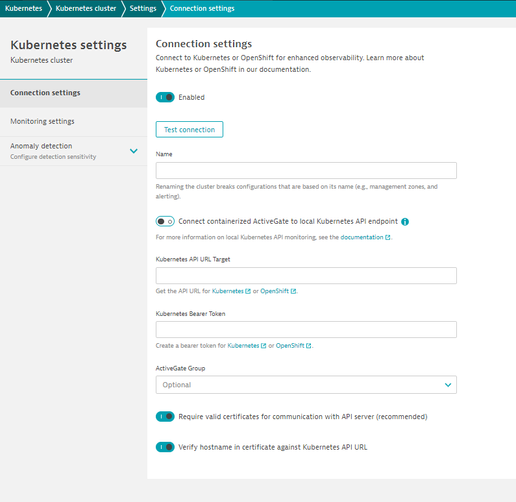
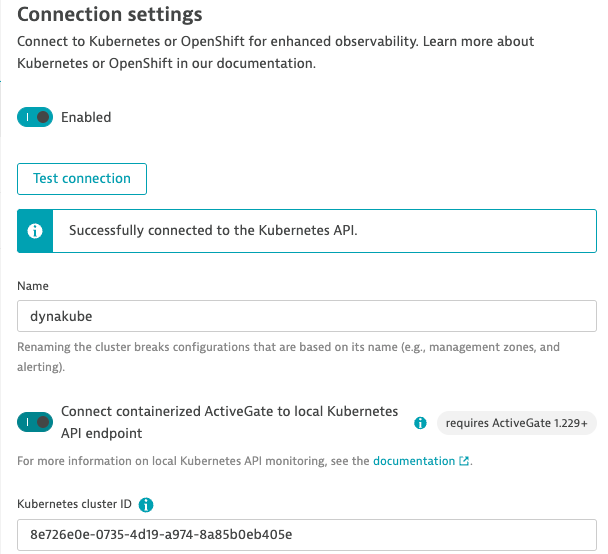
My connection screen looks different than the image you've posted:
It looks like you are showing the "Connect containerized ActiveGate to local kubernetes API endpoint" as turned off, whereas in my Dynatrace, that button is turned on and the connection is successful:
But even as this connection shows success, I still do not have the "cluster_name" variable returning any data:
- Mark as New
- Subscribe to RSS Feed
- Permalink
12 Nov 2023 03:41 PM
I re-imported this dashboard and got the same error as you regardless of this set connection.
@andreas_grabner can you give us a hint what we are doing wrong?
- Mark as New
- Subscribe to RSS Feed
- Permalink
13 Nov 2023 12:30 PM
Hi. You are right - the Kubernetes Dashboard is a bit out-of-date. I created it a while ago. In the meantime some of those metrics I used have been renamed. Let me work on this and update the dashboard in both GitHub as well as on the Playgrond Tenant
One more thing on Kubernetes. We just announced the new Kubernetes Observability Experience with our new Kubernetes App. It will be GA'd in a couple of sprints. Good news is that this app will also come with some new out-of-the-box dashboards itself. So - this dashboard that I provided might no longer be needed in the future.
But - let me work on fixing it. As I said - it should mainly be renaming of the metrics as we have renamed some of those k8s metrics in the past couple of weeks
- Mark as New
- Subscribe to RSS Feed
- Permalink
13 Nov 2023 12:37 PM
@andreas_grabner super, thank you very much for your answer.
We will be waiting 😊
- Mark as New
- Subscribe to RSS Feed
- Permalink
04 Dec 2023 05:04 PM
Thank you Andi! This was driving me bat-sh*@ crazy, 🙂

