- Dynatrace Community
- Dynatrace
- Learn
- Dynatrace tips
- Easily convert Data explorer queries to dql for Dashboards, Notebooks and other apps
- Subscribe to RSS Feed
- Mark Topic as New
- Mark Topic as Read
- Pin this Topic for Current User
- Printer Friendly Page
Easily convert Data explorer queries to dql for Dashboards, Notebooks and other apps
- Mark as New
- Subscribe to RSS Feed
- Permalink
07 Feb 2024
08:50 AM
- last edited on
14 Mar 2024
11:04 AM
by
![]() Michal_Gebacki
Michal_Gebacki
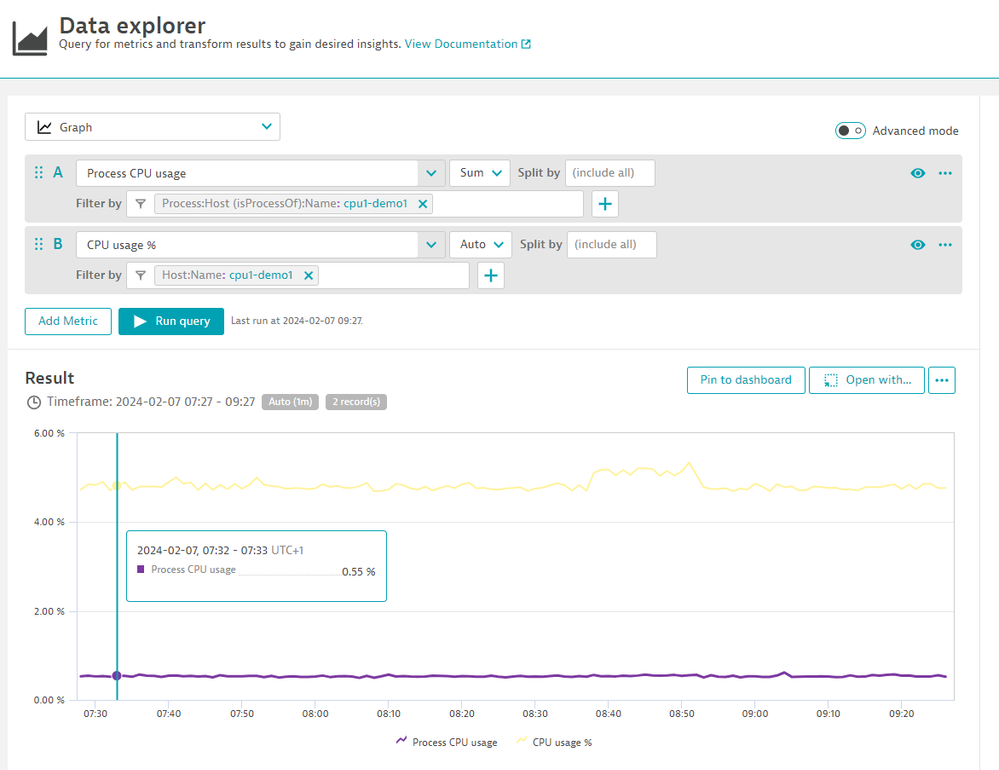
Why do I see differences in metric data between grail based queries and Data explorer?
With grail we have changed the way the data is stored and displayed. DQL allows you to access raw metric data and perform your own transformations to achieve what you want. In case of Data explorer it already does some processing on the data in the background. When trying to play around with timeseries in our new platform you might notice that metric results that you get differ from what you can see in Data explorer - this is most likely due to different processing applied by your query and by Data explorer
How do I get the same results?
To make transition from our classic Data explorer charts easier we have built a tool that will allow you to create a traditional metric query and automatically generate equivalent DQL command.
In Data explorer build your metric query:
To transform it into dql, click on the "Open with" and select your application of choice:
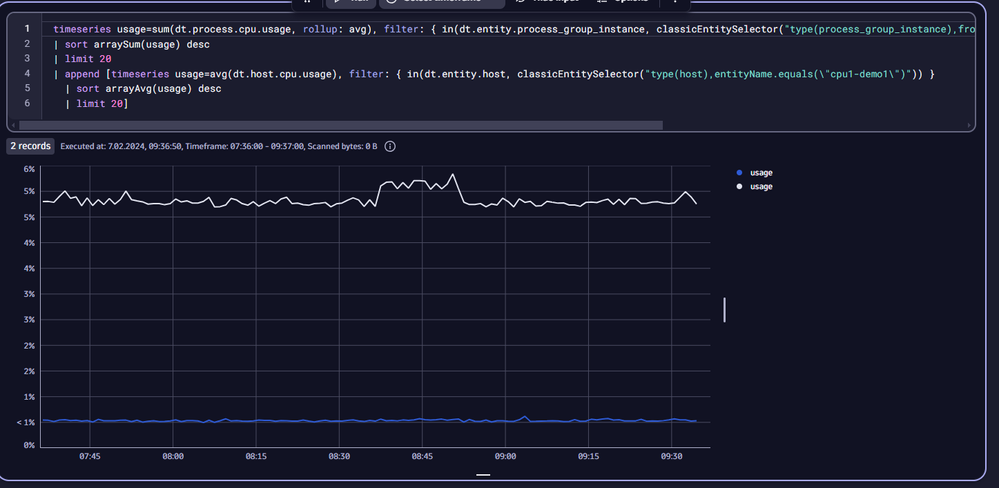
Your query is generated in selected app together with a tile that runs it for you and presents results:
timeseries usage=sum(dt.process.cpu.usage, rollup: avg), filter: { in(dt.entity.process_group_instance, classicEntitySelector("type(process_group_instance),fromRelationship.isProcessOf(type(HOST),entityName.equals(\"cpu1-demo1\"))")) }
| sort arraySum(usage) desc
| limit 20
| append [timeseries usage=avg(dt.host.cpu.usage), filter: { in(dt.entity.host, classicEntitySelector("type(host),entityName.equals(\"cpu1-demo1\")")) }
  | sort arrayAvg(usage) desc
  | limit 20]
This query is designed to provide the same processing that is selected in Data explorer or get as close to it as possible within DQL
- Mark as New
- Subscribe to RSS Feed
- Permalink
07 Feb 2024 07:27 PM
That's an interesting feature!!!
- Mark as New
- Subscribe to RSS Feed
- Permalink
27 Feb 2024 06:59 PM
Great!!! Thanks. Very Useful
- Mark as New
- Subscribe to RSS Feed
- Permalink
12 Apr 2024 06:25 AM
Hi @dawid_rampalski ,
In several cases we find this message when we try to convert a query from Data Explorer to DQL:
Is it because there is not an equivalent metric for DQL?
The Data Explorer query that we can´t convert is using the following metrics:
- builtin:apps.web.actionCount.load.browser
- builtin:apps.web.actionCount.xhr.browse
- builtin:apps.web.visuallyComplete.load.browse
- builtin:apps.web.VisuallyComplete.xhr.browse
In these cases, how can we convert the DataExplorer query to DQL query?
Thanks in advance,
Elena.
- Mark as New
- Subscribe to RSS Feed
- Permalink
12 Apr 2024 06:38 AM
Hi Elena,
that is exactly the reason why. We don't have metrics for applications enabled yet in Grail. You can check the list of currently available builtin metrics here: https://docs.dynatrace.com/docs/observe-and-explore/metrics/built-in-metrics-on-grail.
In the case of those there is at this point no way to use them from DQL. We are working on it though 🙂
Best Regards,
Dawid
- Mark as New
- Subscribe to RSS Feed
- Permalink
12 Apr 2024 07:48 AM
Thank you, this is a great help!
- Mark as New
- Subscribe to RSS Feed
- Permalink
19 Apr 2024 06:51 PM
Very useful tip!!


