- Dynatrace Community
- Dynatrace
- Extend
- Extensions
- Re: JMX Counter Metric : TransactionCommitedTotalCount not monotonically increasing
- Subscribe to RSS Feed
- Mark Topic as New
- Mark Topic as Read
- Pin this Topic for Current User
- Printer Friendly Page
- Mark as New
- Subscribe to RSS Feed
- Permalink
28 Dec 2023 06:04 PM
Hello Community,
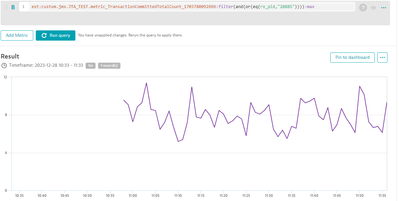
I am trying to calculate Transactions/second from the custom JMX Metric: TransactionCommitedTotalCount . My plan is to apply the delta and rate transformations to the metric to derive Transactions/second. But when I graph the metric with just the max aggregation , I see it is not monotonically increasing as expected. To derive the rate accurately, I would need the metric to be always increasing. What am I missing here ?
Solved! Go to Solution.
- Mark as New
- Subscribe to RSS Feed
- Permalink
28 Dec 2023 06:37 PM
This is from a custom EF 2.0 JMX extension or a 1.0 extension? I can't tell because the key suggests it may have been a converted one.
In either case, what you're seeing is likely the 'delta' already, so if you plan on using the delta transformation anyway you could just use this and skip that extra step. Typically, for counters we want the delta reported rather than rely on transformations being applied to a number that constantly increases.
For EF1 you want to make sure the 'calculateDelta' attribute in the plugin.json is set to false: https://docs.dynatrace.com/docs/shortlink/extensions-jmx-customize#source. Notice there is also an attribute if you want the rate calculated for you as well.
For EF2 you need to have the metric 'type' set to gauge. You'll also want to append ".gauge" to the end of the metric key as we don't like gauge metrics that end with any form of "count." Count type metrics are counters where the difference between intervals is reported instead of the absolute value.
- Mark as New
- Subscribe to RSS Feed
- Permalink
28 Dec 2023 07:02 PM
Thanks for you quick response, I believe this is EF1, here is my configuration JSON :
- Mark as New
- Subscribe to RSS Feed
- Permalink
28 Dec 2023 07:10 PM
This is clearer. It looks like since you have calculateDelta set to false and calculateRate set to true what values you are having reported is the absolute value but already calculated as a rate metric so it's the absolute value at that point transformed into a rate which would be an unusual value.
Additionally, I see you have a Name dimension and you'd want to split by that in your tests as different 'Names' with different values would also skew what you're trying to test. For what you're trying to do I would have calculateDelta and calculateRate to true. If you think you may want to use different rate 'bases' and have control over that I would set calculateRate to false first otherwise you'd be doing the rate of a rate.
- Mark as New
- Subscribe to RSS Feed
- Permalink
28 Dec 2023 07:15 PM
I totally get it now, thanks for the insight !

