- Dynatrace Community
- Dynatrace
- Extend
- Extensions
- Problem with ElasticSearch extension
- Subscribe to RSS Feed
- Mark Topic as New
- Mark Topic as Read
- Pin this Topic for Current User
- Printer Friendly Page
- Mark as New
- Subscribe to RSS Feed
- Permalink
07 Nov 2023 10:28 AM
Hi,
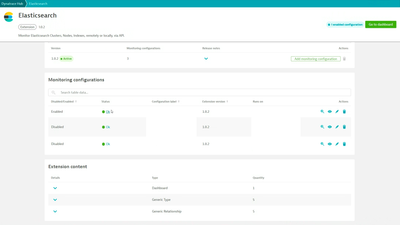
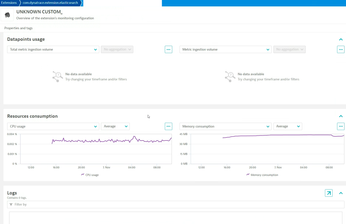
I have an ElasticSearch extension installed on one of my environments. Despite the correct configuration, only the CPU and Memory metrics appear. I do not have any log entries indicating errors.

Has anyone encountered this problem?
Radek
Solved! Go to Solution.
- Labels:
-
elasticsearch
-
extensions
- Mark as New
- Subscribe to RSS Feed
- Permalink
07 Nov 2023 08:19 PM
Hi,
I believe it would be helpful to first verify that the filters and feature sets are configured to allow data to be ingested, and then to look at the logs for the extension. For an ActiveGate deployment this can be found by running "Run ActiveGate diagnostics", and by running "Run OneAgent diagnostics" for a OneAgent deployment. The extension logs could help to show any issues with the extension execution, and the "diag_executor" logs will show how many metrics should be ingested every minute.
Please let us know if this is helpful, and if there is any further support we can provide for this issue.
Tyler
- Mark as New
- Subscribe to RSS Feed
- Permalink
08 Nov 2023 07:01 PM
Hi @radek_jasinski ! It seems that you are looking at the "technical" extension metrics view. Here, the CPU and RAM metrics are related to the extension's system usage on the host or ActiveGate.
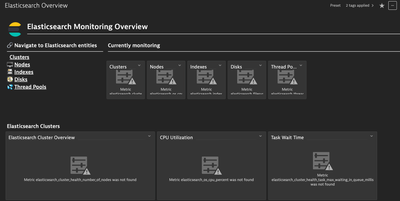
Do you have metrics or entity in the preset dashboard ?
- Mark as New
- Subscribe to RSS Feed
- Permalink
09 Nov 2023 09:45 AM
Hi @jegron
I don't have any metrics available on that cockpit you showed. I also verified the metrics that are available from this plugin and I don't have a value anywhere.
Radek
- Mark as New
- Subscribe to RSS Feed
- Permalink
09 Nov 2023 09:50 AM
Please go ahead and open a support ticket.


