- Dynatrace Community
- Dynatrace
- Extend
- Extensions
- SAP ABAP extension - missing dialog network time for 1 server
- Subscribe to RSS Feed
- Mark Topic as New
- Mark Topic as Read
- Pin this Topic for Current User
- Printer Friendly Page
SAP ABAP extension - missing dialog network time for 1 server
- Mark as New
- Subscribe to RSS Feed
- Permalink
15 Jul 2022
07:00 PM
- last edited on
16 May 2023
02:10 PM
by
![]() Michal_Gebacki
Michal_Gebacki
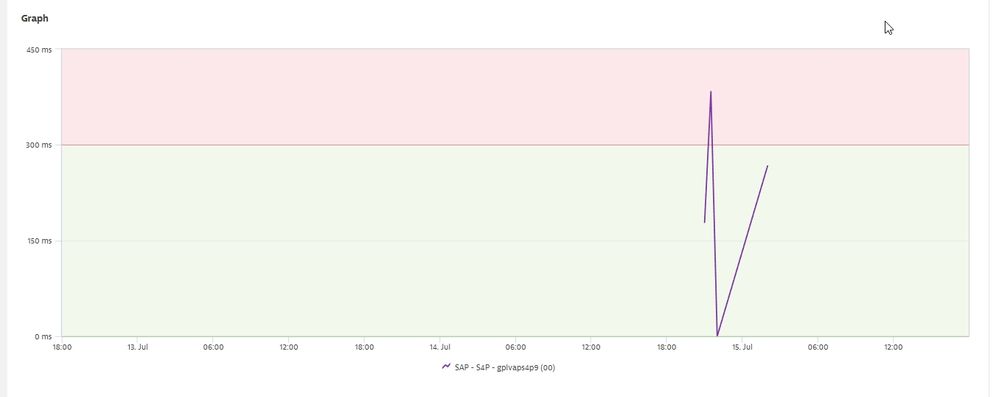
I am using SAP ABAP extension. We get metrics for dialog network time for all servers except 1 of them. We check SAP side and we can pull the data, but on Dynatrace side its -- for GUI response. We checked the response time in S4P system in ST03N t-code and we do have data there. No data in Dynatrace, except there was a single dot in today timeframe and that was it.
How can we troubleshoot what's going wrong here? Problems/Alerts for the host were checked and were ruled out to be normal alerts/problems. At least we have a single dot of data for today.
And for 72 hours, we have about 3 dots it looks like, I've attached it below:
- Labels:
-
extensions
-
metrics
-
sap
-
troubleshooting
- Mark as New
- Subscribe to RSS Feed
- Permalink
02 Aug 2022 11:41 PM
Have you configured to poll once every minute or once every 5 minutes?
Can you try with a less restrictive client number if you don’t already use that, such as 001?

