- Dynatrace Community
- Dynatrace
- Ask
- Open Q&A
- AIX Memory utilization break down
- Subscribe to RSS Feed
- Mark Topic as New
- Mark Topic as Read
- Pin this Topic for Current User
- Printer Friendly Page
AIX Memory utilization break down
- Mark as New
- Subscribe to RSS Feed
- Permalink
26 Dec 2023
06:39 AM
- last edited on
06 Feb 2024
01:12 PM
by
![]() MaciejNeumann
MaciejNeumann
Hi,
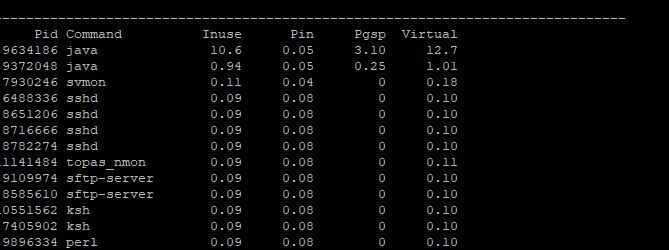
Displaying the memory of one of AIX servers with 16 GB memory allocated , shows that utilization is 99%, when trying to look the break down of that by looking at the processes memory break down , they do not like relevant , the sum of all processes memory shows something below 3 GB.
using the AIX command svmon -P -O summary=basic,unit=GB, shows relevant information, I have attached some pictures of the case
Any Idea of why Dynatrace is not displaying the correct processes memory utilization.
- Labels:
-
aix
-
host monitoring
- Mark as New
- Subscribe to RSS Feed
- Permalink
26 Dec 2023 11:14 AM
What timeframe did you use for the screenshots? Please notice that the value shown is the last value (despite saying Average), so please check the evolution.
But imagining that both data have been taken at the same time, and that issues like shared memory don't seem plausible, I would suggest opening a ticket. Support will be able to look deaper at this issue.
- Mark as New
- Subscribe to RSS Feed
- Permalink
27 Dec 2023 05:01 AM
Timeframe is the same. I have opened a ticket for that.
- Mark as New
- Subscribe to RSS Feed
- Permalink
28 Dec 2023 01:30 PM
Hi @balkhdoor, we would really appreciate it if, once you have a solution, you get back to share it with the Community! Thank you 🙂
- Mark as New
- Subscribe to RSS Feed
- Permalink
29 Jan 2024 08:02 AM
Hi @Ana_Kuzmenchuk , Yes Sure will do that. Actually case still opened and working on it with the support.


