- Dynatrace Community
- Dynatrace
- Ask
- Open Q&A
- Can't identify missing time on Distributed Trace
- Subscribe to RSS Feed
- Mark Topic as New
- Mark Topic as Read
- Pin this Topic for Current User
- Printer Friendly Page
Can't identify missing time on Distributed Trace
- Mark as New
- Subscribe to RSS Feed
- Permalink
11 Apr 2024 04:48 AM
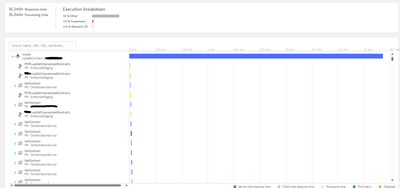
Good evening. Working through a problem where we have a process that is taking 16 minutes to complete. We're using distributed traces to identify why the process is taking so long but unfortunately we're left with a large amount of "unknown". Here's an example:
If I were to scroll the entire window, none of the calls would fill "left to right", each call individually is roughly 1 second or so.
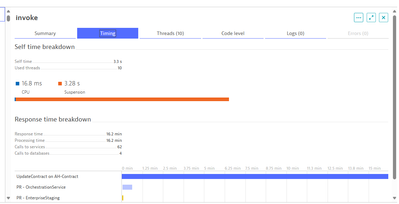
If I look at the timing details of the 16 minute call I see this:
So, I'm confused. I don't see what's causing this overall call to run for as long as it is, and as I explore Dynatrace nothing jumps out. Ideas on what I may be missing?
- Labels:
-
distributed traces
- Mark as New
- Subscribe to RSS Feed
- Permalink
11 Apr 2024 06:35 AM
Hi @PickleRick ,
It seems you can´t click on "View Method Hotspots" button because is missing.
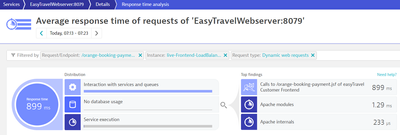
Have you tried to click on "Invoke" on the tree, then "Summary" tab and then on the Request "UpdateContract on ..."? Maybe from there you can go to "View method hotspots" section and then viewing the top findings of the request. I mean, get to see something like:
Hope it helps you.
Regards,
Elena.
- Mark as New
- Subscribe to RSS Feed
- Permalink
11 Apr 2024 02:56 PM
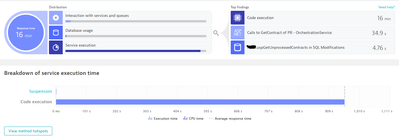
Thanks Elena! I could see some hotspots, but even this isn't giving me the insight I'm looking for (it could very well be here and I'm simply missing it.. but.. I'm not seeing it 🙂
Choosing Code Execution gives me:
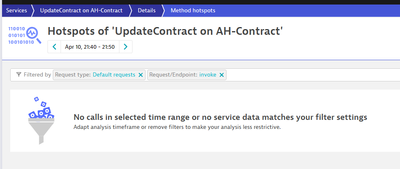
And choosing "Method Hotspots" gives me....
Which is irritating, right!? Feels like whatever I need should be here...
- Mark as New
- Subscribe to RSS Feed
- Permalink
11 Apr 2024 04:11 PM
Hi @PickleRick ,
Have you tried changing the timeframe in Method hotspots? Select for instance "Last 24 hours". And also remove "Request type: Default requests" filter.
Regards,
Elena.
