- Dynatrace Community
- Dynatrace
- Ask
- Open Q&A
- End point and response time in dashboards
- Subscribe to RSS Feed
- Mark Topic as New
- Mark Topic as Read
- Pin this Topic for Current User
- Printer Friendly Page
- Mark as New
- Subscribe to RSS Feed
- Permalink
31 Jan 2024
11:52 AM
- last edited on
07 Mar 2024
08:28 AM
by
![]() Michal_Gebacki
Michal_Gebacki
Hi All,
We want to chart the response time that is measured by Dynatrace of all Endpoints in a MZ.
This metric is measured and displayed by Dynatrace in the "Service Details" view by default.
Now, not only that marking all these endpoints as Key requests is unnecessary, there is also a limitation per Service and Env for Key Requests that we will surpass in this way.
There is a way to chart this without marking all these end points as KR, right? right??
Crossing my fingers that such a basic option exists this top of the line observability platform.
Yair
Solved! Go to Solution.
- Labels:
-
dashboards
-
services
- Mark as New
- Subscribe to RSS Feed
- Permalink
31 Jan 2024 12:05 PM
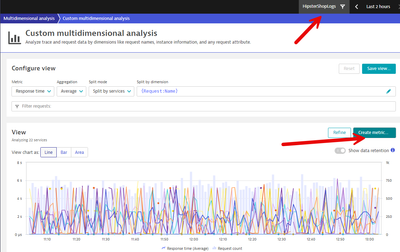
You can try with a custom metric via MDA
- Mark as New
- Subscribe to RSS Feed
- Permalink
31 Jan 2024 12:18 PM
Hello @yair_mashmor
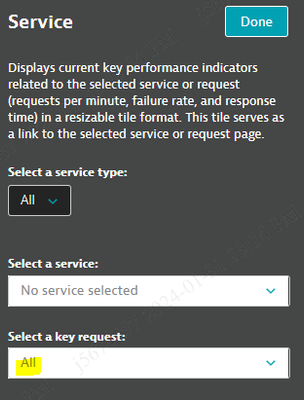
Did you try the following with the service type & service combination? If yes, then I don't think that there is a straightforward way to display data on the dashboard.
Regards,
Babar
- Mark as New
- Subscribe to RSS Feed
- Permalink
31 Jan 2024 01:41 PM
Thank you guys,
I think @PacoPorro solution might work - created one and letting it run and collect data.
Thank you!


