- Dynatrace Community
- Dynatrace
- Ask
- Open Q&A
- Gap in Traces timing breakdown
- Subscribe to RSS Feed
- Mark Topic as New
- Mark Topic as Read
- Pin this Topic for Current User
- Printer Friendly Page
- Mark as New
- Subscribe to RSS Feed
- Permalink
14 Jul 2023 11:01 AM
Hello,
I have a question
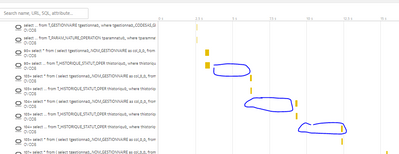
what would explain a gap in the trace timing breakdown ?
when i try to breakdown the time i see gaps (like the screenshot)
Solved! Go to Solution.
- Labels:
-
distributed traces
- Mark as New
- Subscribe to RSS Feed
- Permalink
18 Jul 2023 04:00 AM
Hey Sobe,
In your example we see just DB calls but presumably above that there is another span that kicked off all of these. What's likely happening in those gaps is code execution related to the span that kicked off these DB calls. So something will be running, making DB calls, then doing some transformations or something else related to the data it got back, then running more DB calls, rinse and repeat. Without knowing the application it's difficult to say exactly. Those yellow sections should just be execution time for the DB calls.
You could also click on the parent span and then look at the code level tab to see if anything was captured as happening in-between.
Hope this helps point you in the right direction!

