- Dynatrace Community
- Dynatrace
- Ask
- Open Q&A
- Re: How to find JVM restart reason ? Seems like OS is killing the JVM. Is reason not traced by Dynatrace ? Attached screenshots
- Subscribe to RSS Feed
- Mark Topic as New
- Mark Topic as Read
- Pin this Topic for Current User
- Printer Friendly Page
How to find JVM restart reason?
- Mark as New
- Subscribe to RSS Feed
- Permalink
01 May 2023
04:21 PM
- last edited on
05 May 2023
12:45 PM
by
![]() Karolina_Linda
Karolina_Linda
Hi Community,
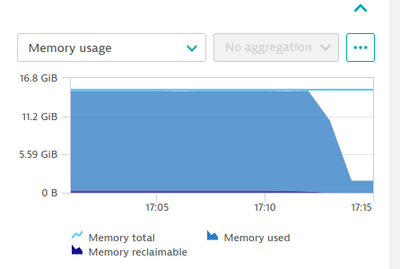
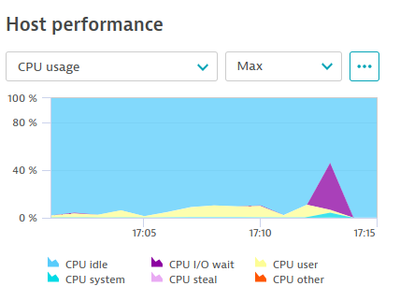
Seems like OS is killing the JVM. Is reason not traced by Dynatrace ? Attached screenshots
The jboss wildfly server is going down due to some reason after some time.
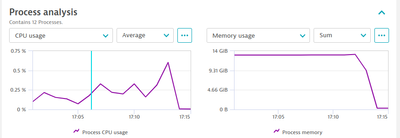
For particular interval of time when the JVM re-started, there was no such drastic change in CPU usage, Memory load, Thread count. Same with Network, IO, File etc.
However the restart reason is not tracked by Dynatrace.
Any idea how it can be figured out?
Entire System Memory : 14 GB / 15.1 GB constant
Entire CPU usage : Not exceeded 40 %
Memory / CPU usage for Wildfly server :
Any suggestions are welcomed
Thanks
- Mark as New
- Subscribe to RSS Feed
- Permalink
01 May 2023 04:53 PM
Hi,
Is any information showed in events section?
Do you have logs integrated in Dynatrace?
Best regards


