- Dynatrace Community
- Dynatrace
- Ask
- Open Q&A
- Re: OpenTelemetry Spans are not linked
- Subscribe to RSS Feed
- Mark Topic as New
- Mark Topic as Read
- Pin this Topic for Current User
- Printer Friendly Page
OpenTelemetry Spans are not linked
- Mark as New
- Subscribe to RSS Feed
- Permalink
08 Jan 2024
02:09 PM
- last edited on
09 Jan 2024
08:12 AM
by
![]() MaciejNeumann
MaciejNeumann
Hi,
I’m doing a POC on OpenTelemetry for my Python application with oneagent. I followed the steps https://docs.dynatrace.com/docs/extend-dynatrace/opentelemetry/walkthroughs/python/python-manual
Hi,
I created one root span and multiple child spans as below.
Root Span
Child Span 1
Child Span 2
Child Span 3
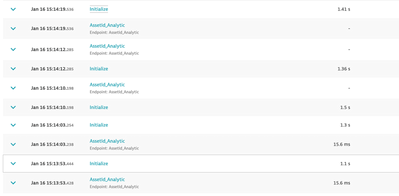
But on the Dynatrace UI I don’t see the spans being created properly, For some executions I can see correct spans and but for some others i don't all the spans.
I have attached the images that shows correct and Incorrect spans. The InCorrect Spans shows the parent span id also. I want to know why the Dynatrace is not showing the Spans correctly?
Regards,
PK
- Labels:
-
opentelemetry
- Mark as New
- Subscribe to RSS Feed
- Permalink
08 Jan 2024 02:15 PM
I'm not making any network calls in my code. I'm creating the spans in one method.
- Mark as New
- Subscribe to RSS Feed
- Permalink
08 Jan 2024 07:19 PM
Can you share your code snippet? Depending on your case it you might need to wait a minute or two so Dynatrace will stitch the full trace from spans, especially if they come from different sources. What span kinds are you sending?
- Mark as New
- Subscribe to RSS Feed
- Permalink
09 Jan 2024 07:36 AM
I see no issues here and your code works for me:
If you are propagating the context between processes, are you propagating it correctly?
Also, I'd recommend setting span kind at least for the root spans .
- Mark as New
- Subscribe to RSS Feed
- Permalink
09 Jan 2024 08:55 AM
Actually I'm calling that method multiple times. Every time i'll pass the different values for AssetId and Analytic. Randomly I also saw the correct span being created. But most of the time spans are not created properly. Please see the Correct_Span.pdf file which is attached to question.
Initially i didn't pass the span context as there is no network call involved. But someone suggested to pass the Context.
Meanwhile i'll also try set the span kind to the root span.
- Mark as New
- Subscribe to RSS Feed
- Permalink
09 Jan 2024 09:27 AM
You should not use the context propagation if you are still within the same process - the context is propagated automatically unless you use for example two continuous processing threads or there is inter-process communication.
Also, are you sure you are calling the start span from the correct scope?
See my snippet below which works fine for me.
import socket
from opentelemetry import trace
from opentelemetry.trace import SpanKind, Status, StatusCode
from opentelemetry.sdk.trace import TracerProvider, sampling
from opentelemetry.sdk.resources import Resource
from opentelemetry.sdk.trace.export import (BatchSpanProcessor,
                                            ConsoleSpanExporter)
from opentelemetry.exporter.otlp.proto.http.trace_exporter import OTLPSpanExporter
from opentelemetry.trace.propagation.tracecontext import \
    TraceContextTextMapPropagator

import time
import random
import json


merged = dict()
for name in ["dt_metadata_e617c525669e072eebe3d0f08212e8f2.json", "/var/lib/dynatrace/enrichment/dt_metadata.json"]:
  try:
    data = ''
    with open(name) as f:
      data = json.load(f if name.startswith("/var") else open(f.read()))
      merged.update(data)
  except:
    pass

merged.update({
  "telemetry.sdk.language": "Python",
  "service.name": "Sample Service",
  "service.version": "1.0",
})
resource = Resource.create(merged)

tracer_provider = TracerProvider(sampler=sampling.ALWAYS_ON, resource=resource)

trace.set_tracer_provider(tracer_provider)
#trace.get_tracer_provider().add_span_processor(BatchSpanProcessor(ConsoleSpanExporter()))
trace.get_tracer_provider().add_span_processor(
    BatchSpanProcessor(OTLPSpanExporter(
        endpoint="https://xxxx.live.dynatrace.com/api/v2/otlp/v1/traces", #TODO Replace <URL> to your SaaS/Managed-URL as mentioned in the next step
        headers={
            "Authorization": "Api-Token xxxx" #TODO Replace <TOKEN> with your API Token as mentioned in the next step
        },
    ))
)


tracer = trace.get_tracer(__name__)

prop = TraceContextTextMapPropagator()

for i in range(1,5):
    spanname = f"AssetId_Analytic"
    with tracer.start_as_current_span(spanname, kind=SpanKind.SERVER) as span:
        with tracer.start_as_current_span("Initialize") as span1:
            hostname = socket.gethostname()
            ip_address = socket.gethostbyname(hostname)

            span1.set_attribute("ip", ip_address)
            span1.set_attribute("initial.memory", 0)
            span1.add_event("Before _initialize_inputs")
            '''
                Code to preprocess the data
            '''
            time.sleep(0.1*random.random())
            span1.add_event("End of Initialization block")

        with tracer.start_as_current_span("LaunchAnalytic") as span2:
            span2.add_event("Start calling Analytic")
            span2.set_attribute("memory.before.calling.analytic", 0)
            time.sleep(0.2*random.random())
            span2.set_attribute("memory.after.calling.analytic", 5)
            span2.add_event("End calling Analytic")

        with tracer.start_as_current_span("PostProcessing") as span3:
            span3.add_event("Processing Output")
            time.sleep(0.3*random.random())
            span3.set_attribute("final.memory", 5)
            span3.add_event("End of User Analyze")
- Mark as New
- Subscribe to RSS Feed
- Permalink
09 Jan 2024 09:38 AM
I see the below differences in my code
1) Getting the tracer object. I'm getting the tracer object as
tracer = get_tracer_provider().get_tracer("my.tracer")2) I didn't put time.sleep.
3) I'm using one agent. I'll not pass the api token.
and ofcourse context.
let me try to run with updated tracer and putting sleep.
- Mark as New
- Subscribe to RSS Feed
- Permalink
16 Jan 2024 06:18 PM
Hi @Julius_Loman,
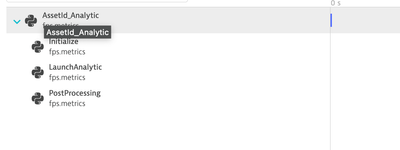
Today I incorporated the code that creates the sample spans into my actual code. I'm able to see the sample spans are created properly. Please see the below screen shot
Showing the correct spans.
But my actual code still doesn't show the spans correctly. The only difference is in place of
'''
Code to preprocess the data
'''
i put my actual code in all spans.
- Mark as New
- Subscribe to RSS Feed
- Permalink
16 Jan 2024 07:54 PM
It's difficult to help without seeing the code. Based on the screenshot it looks like the subspans are not inside the main span (wrong block).
- Mark as New
- Subscribe to RSS Feed
- Permalink
19 Jan 2024 03:03 PM
Hi @Julius_Loman,
I have attached the .txt file(Ideally it should be .py). Here is the flow
1) The client application makes a call to this analytic.py
2) After it initialises, it calls function "user_analyse" (line no 80). I have created spans in this function.
3) I have not attached other files which analytic.py requries.
4)There are multiple clients which is calling is the user_analyse function.
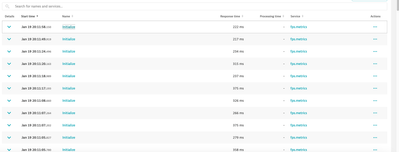
5)The output spans are look like below.
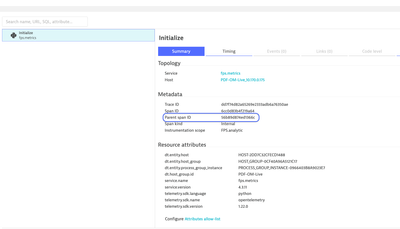
6) I can see the Parent span Id in each span. But that parent span not visible on the DT UI.
- Mark as New
- Subscribe to RSS Feed
- Permalink
24 Jan 2024 05:02 AM - edited 24 Jan 2024 05:25 AM
I tried to call the methods(initialize_span, launch_analytic, proecessoutput) with in the span also. But that also didn't resolve the issue.
  with tracer.start_as_current_span(spanname, kind=SpanKind.SERVER) as span1:
            with tracer.start_as_current_span("Initialize") as span2:
                (configuration, filtered_input_data, input_data, buffer_delta, date_begin) = \
                self.initialize_span(configuration, input_data, input_state)

            with tracer.start_as_current_span("LaunchAnalytic") as span3:
                results_dict = self.launch_analytic(configuration, filtered_input_data, buffer_delta, date_begin)

            with tracer.start_as_current_span("PostProcessing") as span4:
                (ans_json, input_state) = self.proecessoutput(results_dict, input_state, configuration,input_data)
                return [ans_json, input_state, self.alarm_manager.get_all_alarm_results()]


